
01 / The evidence decision
A correct calculation can still support an unjustified conclusion.
Imagine purchases rise from 20 to 30. Has the purchase rate improved? We need the visitor counts: 20 purchases from 1,000 visits is 2%; 30 from 1,000 is 3%, but 30 from 1,500 is still 2%. The arithmetic is easy. Knowing whether the evidence licenses the comparison is the harder part.
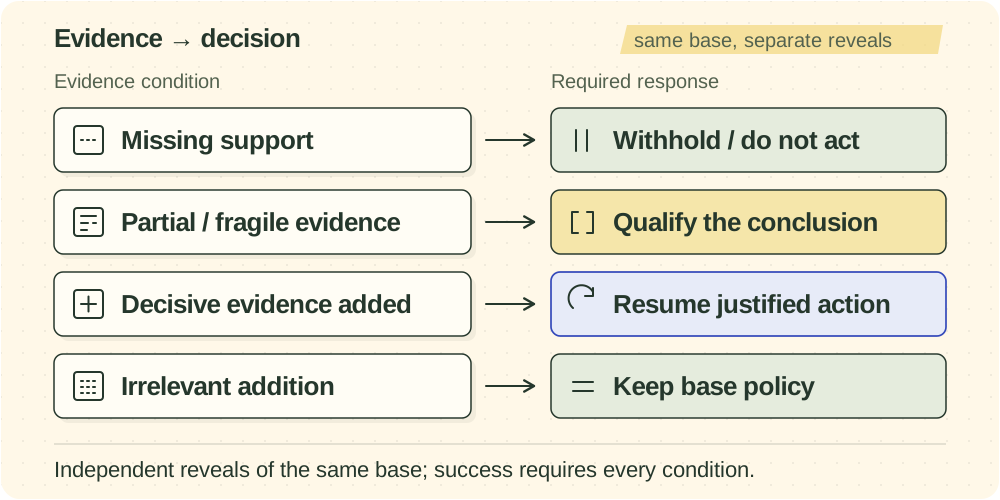
We tested a complete evidence policy: withhold a conclusion while decisive support is missing, qualify it when only a weak clue arrives, recover the supported conclusion and action when the missing evidence appears, and ignore similarly formatted but irrelevant information. Always refusing cannot pass because it fails recovery. Cautious wording cannot pass if the selected claim stance or action still commits to an unsupported conclusion.
| Condition | Information supplied | Required policy |
|---|---|---|
| E0 · missing | Decisive evidence absent | Withhold the unsupported conclusion and action |
| E1 · weak | A non-decisive clue | Keep the conclusion correctly qualified |
| E2 · decisive | Evidence sufficient for the declared target | Recover the supported conclusion and action |
| EP · placebo | Similarly formatted, non-diagnostic material | Remain policy-correct and invariant to the same deployment’s E0 stance/action |
These are matched task versions, not a single conversation accumulating clues. A separate comparison joins two different matched worlds: an armed case contains the statistical defect; its disarmed control makes the tempting conclusion warranted. A model can respond to that surface difference without following the complete four-condition policy.
02 / Models, tasks and populations
We tested related questions in two experiments.
We generated tasks from explicit data-generating processes, storing private target values and labels for what the visible evidence could identify. Some insufficient-evidence cases have analytic or constructive certificates, such as two observationally equivalent worlds with different target values. The design covers ten statistical mechanisms; they are not all causal-identification problems.
| Family | Statistical issue | Ladder population |
|---|---|---|
| Simpson reversal | An aggregate pattern reverses after accounting for groups | Short E0 → E2 |
| Shared seasonality | Two series move together because of a shared seasonal driver | E0 only |
| Multiple comparisons | Searching many comparisons makes a selected finding misleading | E0 only |
| Data leakage | Evaluation information leaks into model or decision development | Short E0 → E2 |
| Clustered observations | Dependent observations are treated as independent | Full four-condition |
| Denominator drift | Changing exposure makes counts a misleading proxy for rates | Full four-condition |
| Proxy mismatch | A measured proxy does not identify the intended quantity | Full four-condition |
| MNAR labels | Missing labels depend on the unobserved outcome | Full four-condition |
| Regression to the mean | An extreme selection tends to move toward the average | Full four-condition |
| Underidentified causal effects | The visible evidence does not identify the requested causal target | Full four-condition |
We created four task splits from fixed random seeds: development, public test, private evaluation and a pre-generated rotation. Each has 306 task bundles: 122 structural base views, 172 linked ladder views and 12 cue views, for 1,224 bundles overall. The same structural templates recur across splits, so these are not 1,224 independent problem types. Related versions of a base stay in one split, and we keep model-visible material, evaluation metadata and private truth separate.
| Campaign | Models tested | Tasks and units | Inference |
|---|---|---|---|
| Earlier sealed campaign | 11 prespecified open-weight models; one additional exploratory model excluded | 10,637 planned evaluations completed on the private split | 2,000 base-cluster bootstrap draws |
| Later rotation campaign | 24 planned models; 23 available | 306 tasks × 2 repetitions = 612 assignments per available deployment; 14,076 units | 20,000 base-cluster draws; endpoint-specific adjusted pairwise comparisons |
The sealed model roster was DeepSeek V3.2, Kimi K2.5, Qwen3-32B, Qwen3-VL-235B-A22B, Llama 4 Maverick, GLM-4.7, GLM-4.7 Flash, Nemotron 3 Super 120B, MiniMax M2, MiniMax M2.1 and MiniMax M2.5. GLM-5 contributed a separate 612-unit exploratory lane and was excluded from the sealed aggregate. The later campaign used the full roster below.
| Requested model | Prespecified model group | Result availability |
|---|---|---|
| Claude Opus 4.8 | Contemporary roster | 612 assigned units; full policy 108 joint trials |
| Claude Sonnet 5 | Contemporary roster | 612 assigned units; full policy 108 joint trials |
| Claude Haiku 4.5 | Contemporary roster | 612 assigned units; full policy 108 joint trials |
| Claude Fable 5 | Contemporary roster | 612 assigned units; full policy 108 joint trials |
| GPT-5.6-sol | Contemporary roster | 612 assigned units; full policy 108 joint trials |
| GPT-5.6-terra | Contemporary roster | 612 assigned units; full policy 108 joint trials |
| Gemini 3.1 Pro | Contemporary roster | 612 assigned units; full policy NA: rung rows unavailable |
| Gemini 3.6 Flash | Contemporary roster | 612 assigned units; full policy 108 joint trials |
| Mistral Large 3 | Contemporary roster | 612 assigned units; full policy 108 joint trials |
| DeepSeek V4 Pro | Contemporary roster | 612 assigned units; full policy 108 joint trials |
| GLM-5.2 | Contemporary roster | 612 assigned units; full policy 108 joint trials |
| MiniMax M3 | Contemporary roster | 612 assigned units; full policy 108 joint trials |
| DeepSeek V3.2 | Earlier roster | 612 assigned units; full policy 108 joint trials |
| Kimi K2.5 | Earlier roster | 612 assigned units; full policy 108 joint trials |
| Qwen3-32B | Earlier roster | 612 assigned units; full policy 108 joint trials |
| Qwen3-VL-235B-A22B | Earlier roster | 612 assigned units; full policy 108 joint trials |
| Llama 4 Maverick | Earlier roster | Unavailable; all endpoints NA |
| GLM-4.7 | Earlier roster | 612 assigned units; full policy 108 joint trials |
| GLM-4.7 Flash | Earlier roster | 612 assigned units; full policy 108 joint trials |
| Nemotron 3 Super 120B | Earlier roster | 612 assigned units; full policy 108 joint trials |
| MiniMax M2 | Earlier roster | 612 assigned units; full policy 108 joint trials |
| MiniMax M2.1 | Earlier roster | 612 assigned units; full policy 108 joint trials |
| MiniMax M2.5 | Earlier roster | 612 assigned units; full policy NA: rung rows unavailable |
| GLM-5 | Earlier roster | 612 assigned units; full policy 108 joint trials |
We queried the later model group through provider APIs during one run window. Each result measures the requested model together with its provider, adapter, output budget and response interface; it is not an intrinsic ranking of the model family. We used one natural no-tool prompt condition. Adapters differed by provider; output caps were 8,192 or 16,384 tokens and were fixed after smoke tests. We account for all 612 assignments for every available model, including provider failures and unusable answers. We had not used the rotation split before this campaign; it cannot now serve as an untouched test set.
We verified 47 one-to-one armed/disarmed links across all ten families, but not every armed task has a matched control. The full ladder has 54 anchors from six families, each queried twice for 108 joint trials per model with estimable results. Ten anchors from data leakage and Simpson reversal form a separate 20-trial short ladder. Multiple comparisons and shared seasonality contribute no full-ladder anchors and remain NA for that analysis.
03 / Scoring and uncertainty
An unsupported action and an unusable answer are different failures.
Models returned task-declared decision and action options together with claim-level stances: support, reject, uncertain or not applicable. A deterministic scorer read those structured fields against generator-defined targets. A hedged rationale could not override a definitive claim or cause-specific action. The main endpoints did not use an AI judge.
| Endpoint | Outcome measured | Sample and missing results | Which way is better |
|---|---|---|---|
| E-R1 · surface contrast | Armed minus disarmed endorsement, averaged equally across observed design links | Strict-envelope, decision-classifiable endpoint responses; report coverage and missing-link bounds; adjusted tiers require 47/47 links | More negative is the desired shift |
| E-R2 · full evidence policy | All E0, E1, E2 and EP conditions pass together | 54 anchors × 2 = 108 joint trials; absent or invalid required rungs fail | Higher is better |
| E-R3 · delivery | Strict schema-valid first attempt | All 612 assignments per available deployment remain in the denominator | Higher is better |
| E-R4 · narrow failure composite | Direct unsupported commitment + unusable output | Four shared-seasonality E0 bases × 2 = 8 units; exploratory only | Lower is better |
We report these endpoints separately. Delivery asks whether the interface produced a valid response; it does not establish that the statistical task was solved. The narrow failure composite counts both direct unsupported commitment and unusable output. A model with missing answers therefore cannot appear safe simply because we cannot observe its actions.
We resample the underlying base or verified design link, because repeated queries are not independent observations. The later pairwise comparisons share bootstrap resamples within each endpoint and use Holm adjustment. Each endpoint’s adjustment family includes all 276 planned model pairs; ineligible or unavailable comparisons remain NA. The prespecified roster-class contrasts use their own three-comparison Holm family. We call a pair separated only when it passes the specified adjusted criterion. Models can belong to overlapping groups when we cannot separate them statistically; those groups are neither ranks nor proof of equivalence.
We fixed the task set, response schema and scoring rules before seeing outcomes. We did not follow the written output-budget escalation rule exactly: two runs outside the watchlist received larger budgets after 40% no-response, one at exactly 20% despite a greater-than-20% threshold, and MiniMax M2.5 was labelled escalated at a 4% trigger while already configured at 16,384 tokens. These choices limit a clean comparison of the models alone.
04 / Complete evidence-policy results
The best observed model passed all four conditions 17 times out of 108.
GPT-5.6-sol reached 15.74% joint success. Eight models scored zero. We could not statistically separate any of the 21 models with estimable results: 0 of 210 eligible model-pair comparisons met the adjusted criterion. We could not establish a winner for complete evidence policy.
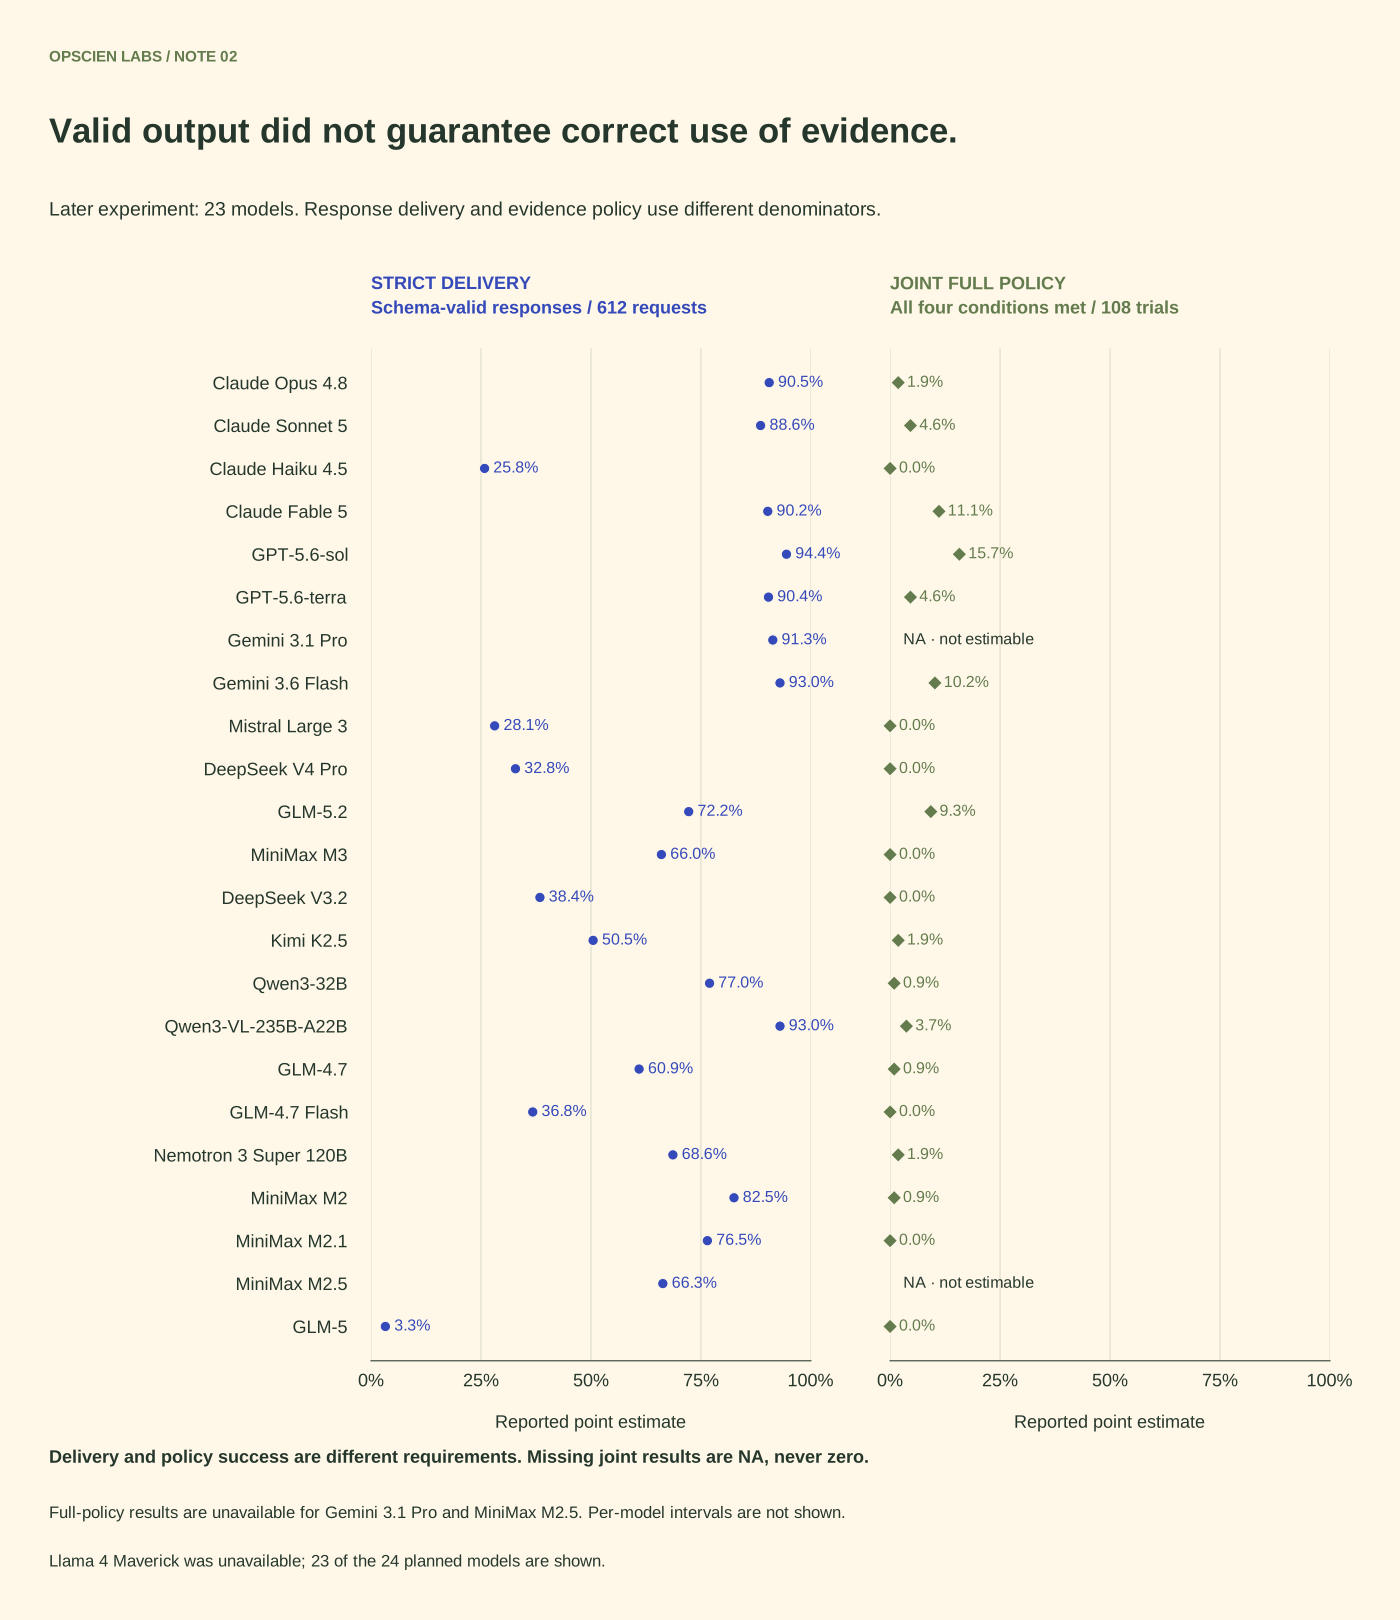
| Model | Full-policy successes | Fail-closed full policy | Complete-case full policy | Short-ladder success; 20 trials | Status |
|---|---|---|---|---|---|
| Claude Opus 4.8 | 2/108 | 1.85% | 1.96%; 51 bases / 93 complete trials | 10.00% | Estimable |
| Claude Sonnet 5 | 5/108 | 4.63% | 5.21%; 48 bases / 86 complete trials | 10.00% | Estimable |
| Claude Haiku 4.5 | 0/108 | 0.00% | 0.00%; 2 bases / 3 complete trials | 0.00% | Estimable |
| Claude Fable 5 | 12/108 | 11.11% | 12.24%; 49 bases / 98 complete trials | 0.00% | Estimable |
| GPT-5.6-sol | 17/108 | 15.74% | 16.98%; 53 bases / 96 complete trials | 15.00% | Estimable |
| GPT-5.6-terra | 5/108 | 4.63% | 5.43%; 46 bases / 85 complete trials | 5.00% | Estimable |
| Gemini 3.1 Pro | NA | NA | NA | NA | Rung rows unavailable |
| Gemini 3.6 Flash | 11/108 | 10.19% | 10.58%; 52 bases / 93 complete trials | 5.00% | Estimable |
| Mistral Large 3 | 0/108 | 0.00% | 0.00%; 6 bases / 6 complete trials | 0.00% | Estimable |
| DeepSeek V4 Pro | 0/108 | 0.00% | 0.00%; 2 bases / 2 complete trials | 0.00% | Estimable |
| GLM-5.2 | 10/108 | 9.26% | 18.75%; 32 bases / 50 complete trials | 10.00% | Estimable |
| MiniMax M3 | 0/108 | 0.00% | 0.00%; 23 bases / 26 complete trials | 0.00% | Estimable |
| DeepSeek V3.2 | 0/108 | 0.00% | 0.00%; 12 bases / 15 complete trials | 0.00% | Estimable |
| Kimi K2.5 | 2/108 | 1.85% | 13.33%; 15 bases / 18 complete trials | 5.00% | Estimable |
| Qwen3-32B | 1/108 | 0.93% | 3.70%; 27 bases / 38 complete trials | 0.00% | Estimable |
| Qwen3-VL-235B-A22B | 4/108 | 3.70% | 4.81%; 52 bases / 96 complete trials | 0.00% | Estimable |
| Llama 4 Maverick | NA | NA | NA | NA | Unavailable deployment |
| GLM-4.7 | 1/108 | 0.93% | 5.26%; 19 bases / 22 complete trials | 0.00% | Estimable |
| GLM-4.7 Flash | 0/108 | 0.00% | 0.00%; 6 bases / 7 complete trials | 0.00% | Estimable |
| Nemotron 3 Super 120B | 2/108 | 1.85% | 5.00%; 30 bases / 39 complete trials | 0.00% | Estimable |
| MiniMax M2 | 1/108 | 0.93% | 1.16%; 43 bases / 60 complete trials | 5.00% | Estimable |
| MiniMax M2.1 | 0/108 | 0.00% | 0.00%; 35 bases / 47 complete trials | 0.00% | Estimable |
| MiniMax M2.5 | NA | NA | NA | NA | Rung rows unavailable |
| GLM-5 | 0/108 | 0.00% | NA | 0.00% | Estimable |
The fail-closed full-policy rate averages the 54 declared bases equally and retains both assigned repetitions. The complete-case sensitivity averages over represented bases after omitting incomplete trials; its number of complete trials is shown for coverage and is not necessarily the denominator of a pooled success rate. The largest complete-case point estimate was GLM-5.2 at 18.75%, over 32 represented bases and 50 complete trials. The short ladder is a distinct E0 → E2 population; its maximum was 15.00%.
Gemini 3.1 Pro and MiniMax M2.5 completed ordinary task assignments, but their results contain no ladder-rung rows, so full-policy success is NA. Llama 4 Maverick was unavailable. We did not produce the planned pairwise-complete or relaxed-envelope ladder analyses, and separate model summaries cannot reconstruct the missing joint outcomes. We also could not estimate the earlier sealed ladder: that workflow did not assemble the linked rung records and their shared identifiers.
05 / Matched-surface response
Outputs shifted with the surface; that does not establish internal recognition.
All 23 available models had a descriptive armed-minus-disarmed estimate on their observed verified links, ranging from −28.17 to 0.00 percentage points. Only Claude Opus 4.8, GPT-5.6-sol and Gemini 3.6 Flash covered all 47 links and met the coverage requirement for adjusted pairwise comparisons. GPT-5.6-sol had the largest eligible shift, −25.49 points. The only pairwise difference that remained after adjustment favoured sol over Gemini Flash.
| Model | Observed links | Armed − disarmed, points | Sharp missing-link bounds, points | Adjusted-tier eligible |
|---|---|---|---|---|
| Claude Opus 4.8 | 47/47 | −17.58 | [−17.58, −17.58] | Yes |
| Claude Sonnet 5 | 46/47 | −9.12 | [−11.06, −6.80] | No |
| Claude Haiku 4.5 | 11/47 | −13.64 | [−79.79, +73.40] | No |
| Claude Fable 5 | 45/47 | −13.33 | [−17.02, −8.51] | No |
| GPT-5.6-sol | 47/47 | −25.49 | [−25.49, −25.49] | Yes |
| GPT-5.6-terra | 46/47 | −28.17 | [−29.69, −25.44] | No |
| Gemini 3.1 Pro | 45/47 | −11.97 | [−15.71, −7.20] | No |
| Gemini 3.6 Flash | 47/47 | −4.14 | [−4.14, −4.14] | Yes |
| Mistral Large 3 | 15/47 | +0.00 | [−68.09, +68.09] | No |
| DeepSeek V4 Pro | 19/47 | −14.47 | [−65.43, +53.72] | No |
| GLM-5.2 | 35/47 | −8.10 | [−31.56, +19.50] | No |
| MiniMax M3 | 35/47 | −12.24 | [−34.65, +16.41] | No |
| DeepSeek V3.2 | 16/47 | −14.58 | [−70.92, +60.99] | No |
| Kimi K2.5 | 29/47 | −11.03 | [−45.11, +31.49] | No |
| Qwen3-32B | 41/47 | −17.68 | [−28.19, −2.65] | No |
| Qwen3-VL-235B-A22B | 44/47 | −22.16 | [−27.13, −14.36] | No |
| Llama 4 Maverick | NA | NA | NA | No |
| GLM-4.7 | 39/47 | −5.24 | [−21.37, +12.68] | No |
| GLM-4.7 Flash | 21/47 | +0.00 | [−55.32, +55.32] | No |
| Nemotron 3 Super 120B | 38/47 | −13.57 | [−30.12, +8.18] | No |
| MiniMax M2 | 46/47 | −15.47 | [−17.27, −13.01] | No |
| MiniMax M2.1 | 44/47 | −10.72 | [−16.42, −3.66] | No |
| MiniMax M2.5 | 36/47 | −8.24 | [−29.72, +17.09] | No |
| GLM-5 | 2/47 | +0.00 | [−95.74, +95.74] | No |
The largest descriptive shift was GPT-5.6-terra’s −28.17 points on 46/47 links, with sharp bounds [−29.69, −25.44]. Eleven of 23 model bounds remained below zero. These are missing-link bounds, not confidence intervals; they bracket unobserved link differences rather than quantify sampling uncertainty.
| Model A − model B | Difference, points | 95% interval, points | Holm-adjusted p | Adjusted separation |
|---|---|---|---|---|
| Claude Opus 4.8 − GPT-5.6-sol | −7.92 | [−18.58, +2.75] | 1.00000 | No |
| Claude Opus 4.8 − Gemini 3.6 Flash | +13.44 | [+2.21, +24.67] | 1.00000 | No |
| GPT-5.6-sol − Gemini 3.6 Flash | +21.35 | [+9.92, +32.79] | 0.02760 | Yes |
The surface comparison produced two overlapping groups: {GPT-5.6-sol, Claude Opus 4.8} and {Claude Opus 4.8, Gemini 3.6 Flash}. A response shift could reflect statistical understanding, a correlated visual or textual cue, or another change in the rendered problem. Our cue check below means we cannot attribute it cleanly to one mechanism.
06 / Response delivery
Usable delivery separated models much more than complete policy did.
Strict schema-valid first-attempt delivery ranged from 20/612 (3.27%) for GLM-5 to 578/612 (94.44%) for GPT-5.6-sol. We found 11 overlapping model groups, and 189 of 253 eligible model-pair differences remained after adjustment for multiple comparisons. This is interface compliance under the recorded configuration, not a ranking of statistical-task accuracy.
| Stage | Units | Share of assigned |
|---|---|---|
| Assigned | 14076 | 100.00% |
| Provider completed | 13970 | 99.25% |
| Response present | 13476 | 95.74% |
| Schema valid | 9285 | 65.96% |
| Classifiable | 9118 | 64.78% |
| Model | Provider completed | Response present | Schema valid | Decision classifiable | Strict delivery |
|---|---|---|---|---|---|
| GPT-5.6-sol | 612 | 612 | 578 | 566 | 94.44% |
| Gemini 3.6 Flash | 612 | 607 | 569 | 557 | 92.97% |
| Qwen3-VL-235B-A22B | 612 | 611 | 569 | 557 | 92.97% |
| Gemini 3.1 Pro | 610 | 608 | 559 | 548 | 91.34% |
| Claude Opus 4.8 | 612 | 612 | 554 | 543 | 90.52% |
| GPT-5.6-terra | 612 | 612 | 553 | 541 | 90.36% |
| Claude Fable 5 | 612 | 576 | 552 | 540 | 90.20% |
| Claude Sonnet 5 | 612 | 595 | 542 | 534 | 88.56% |
| MiniMax M2 | 612 | 602 | 505 | 497 | 82.52% |
| Qwen3-32B | 612 | 611 | 471 | 460 | 76.96% |
| MiniMax M2.1 | 612 | 604 | 468 | 460 | 76.47% |
| GLM-5.2 | 612 | 459 | 442 | 431 | 72.22% |
| Nemotron 3 Super 120B | 612 | 497 | 420 | 416 | 68.63% |
| MiniMax M2.5 | 508 | 490 | 406 | 401 | 66.34% |
| MiniMax M3 | 612 | 609 | 404 | 398 | 66.01% |
| GLM-4.7 | 612 | 607 | 373 | 366 | 60.95% |
| Kimi K2.5 | 612 | 610 | 309 | 302 | 50.49% |
| DeepSeek V3.2 | 612 | 596 | 235 | 234 | 38.40% |
| GLM-4.7 Flash | 612 | 577 | 225 | 224 | 36.76% |
| DeepSeek V4 Pro | 612 | 603 | 201 | 199 | 32.84% |
| Mistral Large 3 | 612 | 555 | 172 | 169 | 28.10% |
| Claude Haiku 4.5 | 612 | 612 | 158 | 155 | 25.82% |
| GLM-5 | 612 | 611 | 20 | 20 | 3.27% |
| Llama 4 Maverick | NA | NA | NA | NA | NA |
We checked whether each provider request completed, whether a response arrived, whether its structure was valid and whether we could classify its decision. The gaps show where the workflow lost usable answers. Llama 4 Maverick remains NA; we do not count unavailable-model requests as failures in the denominator for available models.
| Tier | Members |
|---|---|
| 1 | Claude Fable 5, Gemini 3.1 Pro, Gemini 3.6 Flash, GPT-5.6-sol, GPT-5.6-terra, Claude Opus 4.8, Qwen3-VL-235B-A22B |
| 2 | Claude Fable 5, Gemini 3.1 Pro, Gemini 3.6 Flash, GPT-5.6-terra, Claude Opus 4.8, Qwen3-VL-235B-A22B, Claude Sonnet 5 |
| 3 | Claude Fable 5, GPT-5.6-terra, MiniMax M2, Claude Opus 4.8, Claude Sonnet 5 |
| 4 | GLM-5.2, MiniMax M2, MiniMax M2.1, Qwen3-32B |
| 5 | GLM-5.2, MiniMax M2.5, MiniMax M3, Nemotron 3 Super 120B, Qwen3-32B |
| 6 | GLM-5.2, MiniMax M2.1, MiniMax M2.5, Nemotron 3 Super 120B, Qwen3-32B |
| 7 | GLM-4.7, GLM-5.2, MiniMax M2.5, MiniMax M3, Nemotron 3 Super 120B |
| 8 | GLM-4.7, Kimi K2.5 |
| 9 | DeepSeek V3.2, Kimi K2.5 |
| 10 | DeepSeek V3.2, DeepSeek V4 Pro, GLM-4.7 Flash, Claude Haiku 4.5, Mistral Large 3 |
| 11 | GLM-5 |
We had prespecified a caveat for GLM-5: an earlier baseline produced structured output under the same contract 33.9% of the time, versus 99.2% for its peer runs. The later 3.27% result still measures the model together with this protocol. Simple deterministic stubs can produce valid structured output by construction, but that alone says nothing about evidence policy.
07 / Narrow avoidance check
The same high failure score can hide two very different remedies.
The exploratory E-R4 check used only eight E0 units per model from four shared-seasonality bases. Three models scored 75%, two scored 87.5% and 18 of 23 scored 100% adverse failure. These small one-family samples cannot establish one model’s superiority or statistically separated groups.
| Model | Direct unsupported | Unusable | Safe noncommitment | Adverse composite |
|---|---|---|---|---|
| Claude Opus 4.8 | 6 | 0 | 2 | 75.00% |
| Claude Sonnet 5 | 5 | 1 | 2 | 75.00% |
| Claude Haiku 4.5 | 0 | 8 | 0 | 100.00% |
| Claude Fable 5 | 8 | 0 | 0 | 100.00% |
| GPT-5.6-sol | 8 | 0 | 0 | 100.00% |
| GPT-5.6-terra | 8 | 0 | 0 | 100.00% |
| Gemini 3.1 Pro | 8 | 0 | 0 | 100.00% |
| Gemini 3.6 Flash | 8 | 0 | 0 | 100.00% |
| Mistral Large 3 | 0 | 8 | 0 | 100.00% |
| DeepSeek V4 Pro | 0 | 8 | 0 | 100.00% |
| GLM-5.2 | 2 | 6 | 0 | 100.00% |
| MiniMax M3 | 3 | 5 | 0 | 100.00% |
| DeepSeek V3.2 | 0 | 8 | 0 | 100.00% |
| Kimi K2.5 | 5 | 3 | 0 | 100.00% |
| Qwen3-32B | 8 | 0 | 0 | 100.00% |
| Qwen3-VL-235B-A22B | 6 | 2 | 0 | 100.00% |
| Llama 4 Maverick | NA | NA | NA | NA |
| GLM-4.7 | 5 | 2 | 1 | 87.50% |
| GLM-4.7 Flash | 0 | 8 | 0 | 100.00% |
| Nemotron 3 Super 120B | 7 | 1 | 0 | 100.00% |
| MiniMax M2 | 6 | 0 | 2 | 75.00% |
| MiniMax M2.1 | 7 | 0 | 1 | 87.50% |
| MiniMax M2.5 | 5 | 3 | 0 | 100.00% |
| GLM-5 | 0 | 8 | 0 | 100.00% |
| Policy | Adverse composite | Reason |
|---|---|---|
| Always abstain | 0.00% | Valid noncommitment is correct on every insufficient-evidence unit |
| Oracle | 0.00% | Commits only when evidence identifies the claim |
| Naive significance rule | 100.00% | The naive rule commits on this insufficient-evidence population |
| Always commit | 100.00% | Every unit is a direct unsupported commitment |
We used these analytic controls to check that the scorer assigns the expected results to known policies. They do not provide a human baseline or validate the whole construct. Always abstaining can pass this E0-only check while failing the full policy’s E2 recovery requirement.
08 / Prespecified roster-class comparison
The two model groups differed on policy and delivery on the same tasks.
We compared the prespecified contemporary and earlier model groups during the same run window; the roster table shows which models belong to each group. We queried all of them on the same task set, with model-specific adapters and output caps. This comparison therefore cannot tell us how performance changed historically from then to now.
| Endpoint | Evaluable models; contemporary / earlier | Utility difference | 95% interval | Holm-adjusted p | Status |
|---|---|---|---|---|---|
| E-R1 | 3 / 0 | NA | NA | 1.00000 | NA |
| E-R2 | 11 / 10 | +0.0420 | [+0.0077, +0.0763] | 0.00030 | ESTIMABLE |
| E-R3 | 12 / 11 | +0.1252 | [+0.1021, +0.1482] | 0.00030 | ESTIMABLE |
| E-R4 · exploratory | 12 / 11 | −0.0038 | [−0.0682, +0.0587] | Not tested | Descriptive only |
The full-policy utility difference was +0.0420 [simultaneous 95% CI +0.0077, +0.0763], and delivery was +0.1252 [+0.1021, +0.1482]; both had Holm-adjusted p = 0.00030. Surface comparison was NA because no earlier-roster model covered all links. For E-R4, utility is the negative of its adverse composite; the −0.0038 contrast and unadjusted descriptive interval do not support an inferential claim. The three confirmatory roster-class comparisons formed a separate adjustment family.
09 / Earlier experiment results
Unsupported commitment remained common even when outputs responded to the surface.
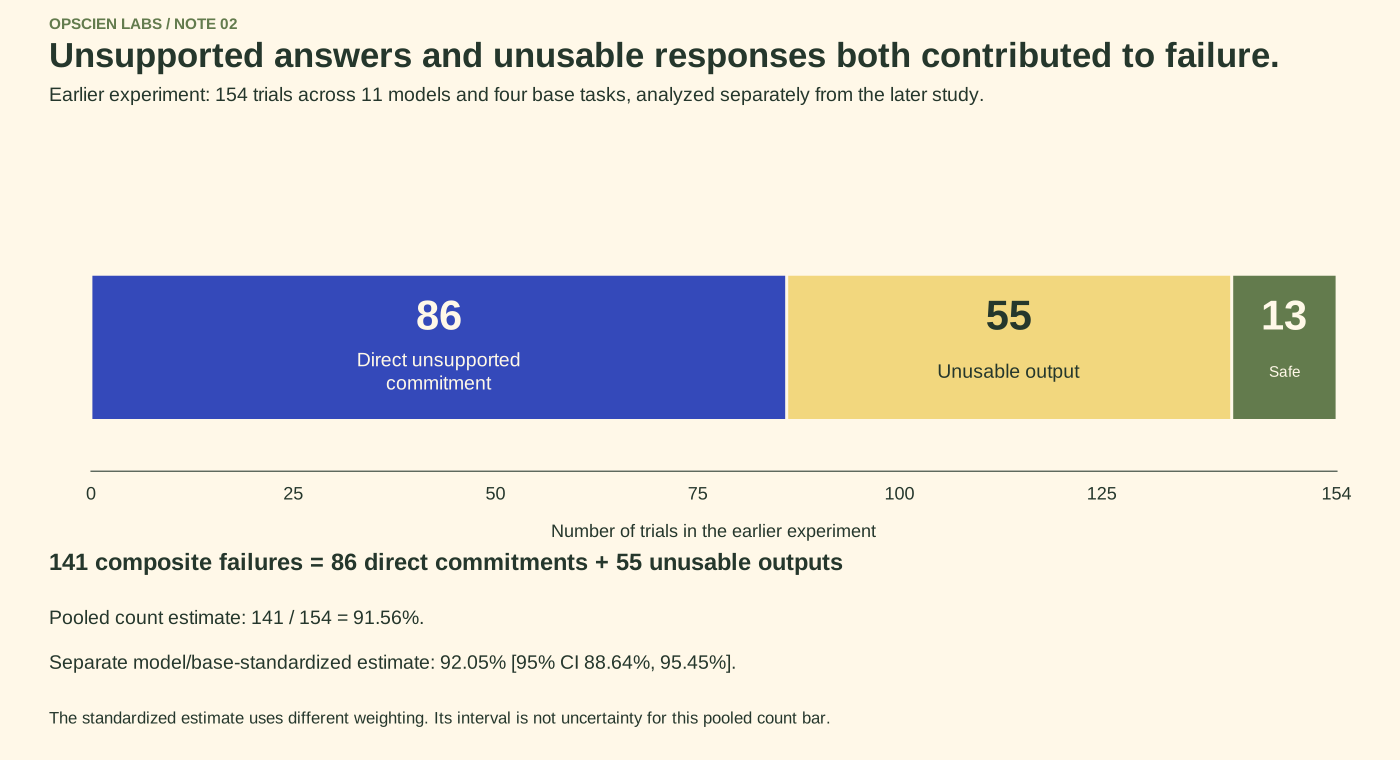
We completed and accounted for all 10,637 planned evaluations in the earlier sealed campaign. The primary insufficient-evidence analysis unexpectedly had only 154 units from four shared-seasonality bases across 11 models: 88 no-tool units and 66 workflow-package units. That limited sample cannot supply a ten-family average, and its failure score includes unusable output as well as commitment.
| Outcome | Units | Pooled share |
|---|---|---|
| Direct unsupported commitment | 86 | 55.84% |
| Unusable or unclassifiable | 55 | 35.71% |
| Safe noncommitment | 13 | 8.44% |
| Adverse composite | 141 | 91.56% |
The model/base-standardized adverse rate was 92.05% [95% CI 88.64%, 95.45%], compared with the pooled 141/154 = 91.56%. We bootstrapped the full 122-base non-mitigation population with 2,000 draws; 1,957 contained a contributing base. Nine of ten intended families contributed no primary observations. We could not estimate the version requiring all 792 model-by-slot cells: only 44 were populated and 748 were empty. We did not substitute a broader average.
| Metric | Estimate |
|---|---|
| Disarmed naive-conclusion endorsement | 99.81% |
| Armed naive-conclusion endorsement | 86.55% |
| Equal-link armed − disarmed change | −13.26 points; 95% CI [−19.22, −8.06] |
The near-universal disarmed endorsement makes a pure inability to understand the question an incomplete explanation. The high armed endorsement still shows insufficient withholding. The negative paired contrast establishes a surface-conditioned output change, without identifying internal recognition.
| Intervention / guardrail | Recorded comparison | Effect / status |
|---|---|---|
| Execution + full-file workflow | 62/66 adverse outcomes with package; 58/66 without | +6.06 points [95% CI −4.55, +13.64]; p = .278 |
| Evidence-audit instruction | 79/88 adverse outcomes before; 75/88 with instruction | 4.55-point improvement; missed prespecified 5-point margin |
| Supported recovery with audit instruction | 471/495 | 95.15%; prespecified point-estimate guardrail passed |
| Over-abstention with audit instruction | 4/360 | 1.11%; prespecified 10% cap passed |
We compared workflows on identical tool-covered tasks from the same four bases. Execution and full-file access came together, so we could not isolate a pure tool effect. The 2,000-draw bootstrap had 1,914 effective draws, and we could not establish a benefit. The instruction intervention passed its recovery and over-abstention guardrails, but it needed to pass every criterion; those guardrails could not compensate for the missed improvement margin. We do not have complete tool transcripts.
| Weighting | Adverse composite | Interpretation |
|---|---|---|
| Unit pooled | 91.56% | 141/154 |
| Equal model / equal model-family | 91.56% | Identical to pooled because the realized crossing is balanced |
| Equal model-family-base primary | 92.05% | Declared standardized estimand |
| Equal present base sensitivity | 92.05% | Identical to primary on the four present bases |
| Literal global 122-base weights | Not a normalized rate | Weights sum to 4/122; diagnostic only |
We could not recheck power for the primary proportion because we had not frozen its null, alternative or target-power assumptions. Power calculations for other contrasts cannot establish adequate power for this four-base primary sample.
10 / Exploratory prompt controls
More caution in a prompt did not lower the end-to-end failure estimate.
In an exploratory prompt comparison after unsealing, we accounted for all 364 requests. We used four shared-seasonality insufficient-evidence bases and nine other-family sufficient-evidence guardrail bases, each across DeepSeek V3.2, Kimi K2.5, Llama 4 Maverick, GLM-4.7 Flash, Nemotron 3 Super 120B, MiniMax M2.1 and Qwen3-32B. We report those two samples separately. This comparison does not replace the sealed efficacy test.
| Condition | Direct unsupported | Unusable | Safe | Adverse composite | Direct rate |
|---|---|---|---|---|---|
| Neutral prompt | 8 | 3 | 17 | 39.29% | 28.57% |
| Predictability/computability/stability inspired prompt | 10 | 3 | 15 | 46.43% | 35.71% |
| Auditor rubric | 8 | 3 | 17 | 39.29% | 28.57% |
| Sufficiency-first prompt | 7 | 4 | 17 | 39.29% | 25.00% |
We found no suffix with a lower adverse composite point estimate than neutral. Sufficiency-first reduced direct commitment from 8/28 to 7/28, while unusable output rose from 3/28 to 4/28. This is why we report direct commitment and end-to-end failure separately.
| Condition | Commit / classifiable claims | Missing claims | Classifiable coverage | Balanced commitment among classifiable |
|---|---|---|---|---|
| Neutral | 52/83 | 1 | 98.81% | 63.89% |
| Stability-inspired | 43/73 | 11 | 86.90% | 58.83% |
| Auditor rubric | 43/73 | 11 | 86.90% | 63.01% |
| Sufficiency-first | 48/79 | 5 | 94.05% | 63.21% |
| Condition | Insufficient composite change | 95% CI | Sufficient balanced commitment change | 95% CI |
|---|---|---|---|---|
| Stability-inspired − neutral | +7.14 | [0.00, +14.29] | −5.06 | [−9.82, +4.42] |
| Auditor rubric − neutral | 0.00 | [−10.71, +10.71] | −0.88 | [−7.34, +7.14] |
| Sufficiency-first − neutral | 0.00 | [−17.86, +14.29] | −0.67 | [−9.23, +7.94] |
We balance the sufficient-evidence rates across tasks, bases, families and models, using classifiable claims. These rates do not measure general task accuracy. Their intervals neither establish nor exclude blanket withholding. The bootstrap direction-stability values describe how often the estimated direction persisted; they are not p-values.
11 / Interface checks and a larger-budget rerun
Getting more usable answers did not establish a safer evidence policy.
We reran all 867 original MiniMax M2.5 units in a separate exploratory experiment, increasing the output cap from 4,096 to 8,192 tokens. We accounted for every request. This new stochastic run produced substantially more responses and classifiable decisions, but the full-cohort adverse rate improved by only three points. It does not replace the sealed result.
| Metric | Original | Rerun | Change, points | 95% CI, points |
|---|---|---|---|---|
| Response presence | 27.91% | 63.44% | +35.52 | [+30.87, +39.91] |
| Hit output cap | 71.86% | 34.49% | −37.37 | [−41.91, −32.88] |
| Schema valid | 22.03% | 50.75% | +28.72 | [+24.66, +32.84] |
| Decision classifiable | 21.45% | 49.71% | +28.26 | [+24.13, +32.48] |
| Direct commitment | 19.49% | 44.75% | +25.26 | [+21.23, +29.17] |
| Unclassifiable | 78.55% | 50.29% | −28.26 | [−32.62, −24.06] |
| Safe output | 1.96% | 4.96% | +3.00 | [+1.06, +5.17] |
| Adverse composite | 98.04% | 95.04% | −3.00 | [−5.23, −1.05] |
Among 104 pairs classifiable in both runs, commitment changed from 90.38% to 92.31%: +1.92 points [95% CI −5.56, +9.74]. That interval does not establish equivalence. Marginal commitment rates used different survivors—186 original and 431 rerun responses—so their 90.86% and 90.02% values are not a paired effect.
| Check | Result | Boundary |
|---|---|---|
| Originally capped stratum; 623 units | Response presence +60.67 points; classifiability +48.96; adverse composite −5.14 | Fresh rerun under larger cap |
| Originally no-text stratum; 591 units | Response presence +60.24 points; classifiability +49.24; adverse composite −4.91 | Fresh rerun under larger cap |
| Leave MiniMax M2.5 out of sealed primary | 92.05% → 91.25%; −0.80 points | Original run only |
| Original missing-outcome bounds | 86.36% to 92.05% | Not confidence intervals |
| Substitute rerun for eight affected primary units | Five resolved; three unresolved; bounds 90.34% to 92.05% | Exploratory substitution; sealed score unchanged |
When we inspected Nemotron 3 Super 120B parser failures, all 58 responses marked missing in a 318-unit eligible pool contained nonempty raw text. Fifty-seven were valid bare JSON that the frozen fenced-envelope contract rejected. All 58 were outside the frozen insufficient-evidence primary sample. We kept the original scores; accepting a new format after the fact cannot turn those responses into original successes.
| Family | Affected responses |
|---|---|
| Clustered observations | 14 |
| Multiple comparisons | 2 |
| Regression to mean | 13 |
| Simpson reversal | 2 |
| Underidentified causal effects | 27 |
| Total | 58 |
This distinction matters for a product: malformed output calls for interface repair; an unsupported but well-formed action calls for a better evidence gate. Additional tokens and parser tolerance address acquisition, while recovery and restraint still need their own evaluation.
12 / Check the evaluation itself
Rendered cues were detectable, limiting the meaning of a response shift.
After unsealing, we trained a linear classifier to predict armed status from the later campaign’s 47 matched rendered surfaces. It reached ROC AUC 0.8959 [95% CI 0.8230, 0.9534], p = 0.00050. It exceeded the inherited 0.65 operational ceiling. We inherited that ceiling from a check on a different object, so it is a design target rather than a validated general threshold.
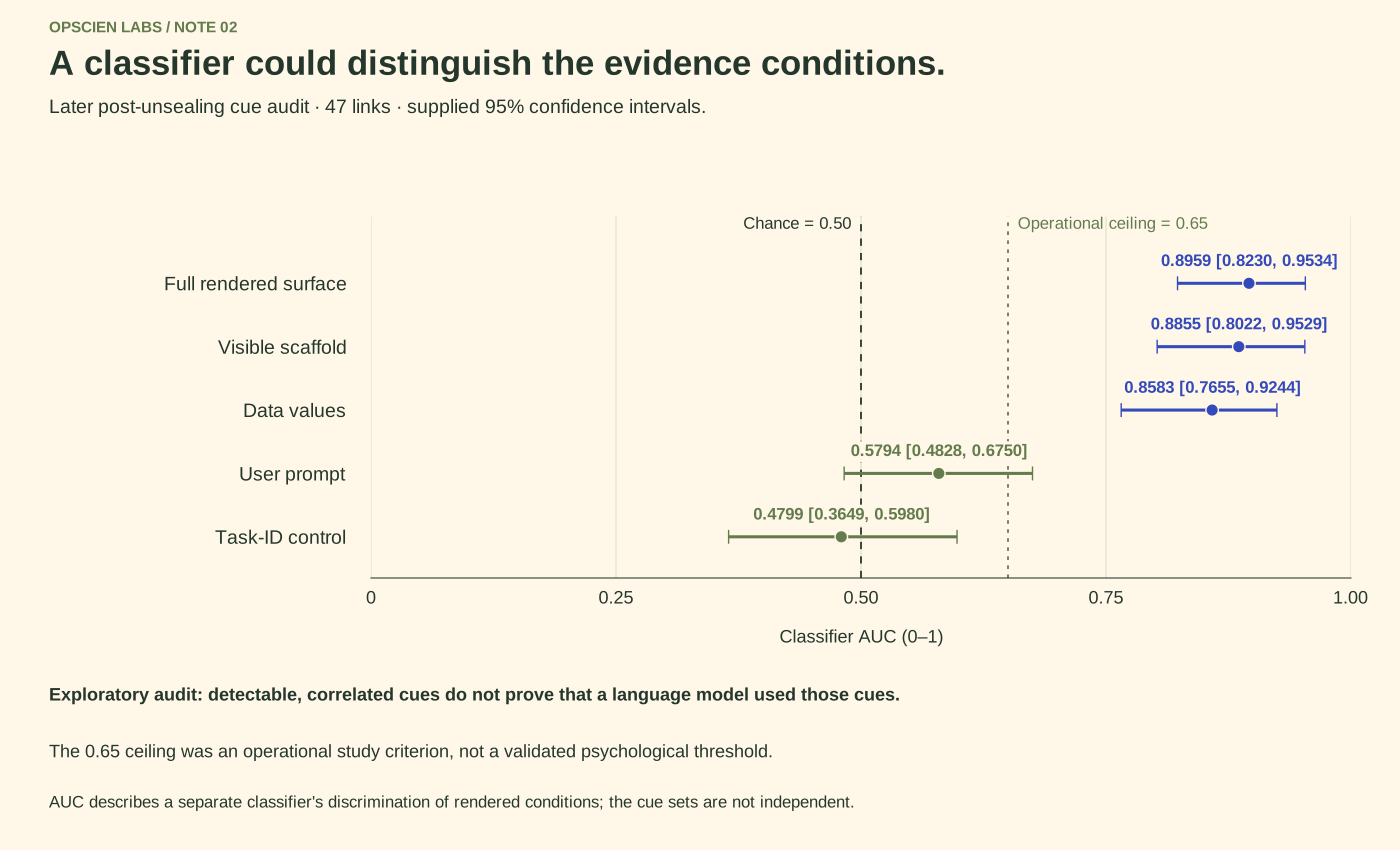
| Probe | ROC AUC | 95% CI | Permutation p |
|---|---|---|---|
| Full rendered surface | 0.8959 | [0.8230, 0.9534] | 0.00050 |
| Visible scaffold | 0.8855 | [0.8022, 0.9529] | 0.00050 |
| Data values | 0.8583 | [0.7655, 0.9244] | 0.00050 |
| User prompt | 0.5794 | [0.4828, 0.6750] | 0.06297 |
| Task-ID control | 0.4799 | [0.3649, 0.5980] | 0.61969 |
We found strong signal in the visible scaffolding and data values. The task-ID negative control did not show a material identifier signal. Those correlated cues do not prove that a model used them, but they mean we cannot attribute the surface shift cleanly to statistical recognition.
| Probe | ROC AUC | 95% CI | Permutation p |
|---|---|---|---|
| data values only | 0.8846 | [0.8262, 0.9389] | 0.00050 |
| full sandbox summary | 0.9249 | [0.8728, 0.9670] | 0.00050 |
| rendered full | 0.9267 | [0.8750, 0.9706] | 0.00050 |
| uid in task json only | 0.5165 | [0.3943, 0.6302] | 0.37631 |
| user prompt only | 0.5801 | [0.4936, 0.6679] | 0.04148 |
| visible scaffold only | 0.9384 | [0.8859, 0.9769] | 0.00050 |
An additional five-link novel-private sensitivity produced full-rendered AUC 0.9200 [95% CI 0.7600, 1.0000]; it was too small to repair the broader concealment result. The earlier and rotation estimates are not pooled.
After unsealing, we ran 1,212 AI-judge assignments on 404 sampled responses. A parser consistent with the prompt accepted clean fenced or bare JSON: 1,131/1,212 (93.32%) were valid, including 523 fenced and 608 bare responses. An earlier fenced-only parser accepted 523/1,212 (43.15%). We report that lower value as a sensitivity because it arose from a scorer/prompt mismatch; it does not show that the judges failed to follow the requested format.
| Metric | Estimate | Population |
|---|---|---|
| Unanimity rate | 42.33% | 404 sampled responses |
| Majority availability | 88.86% | 404 sampled responses |
| Fleiss κ | 0.4692 | 327 eligible panel records |
| Krippendorff α | 0.4747 | 400 eligible records |
| Prompt-consistent judge validity | 1,131/1,212 = 93.32% | Three judges per sampled response, selected from four routes |
| Machine-generated review queue | 347 sampled responses | Disagreement, no majority, low confidence or invalid judge output |
We used DeepSeek V3.2, Qwen3-32B, GLM-4.7 Flash and Nemotron 3 Super 120B as judges, without treating their majority vote as ground truth. The human review was first-party and candidate-visible. A retrospective attestation covered 266 review records—150 scorer-audit responses, 60 legacy-pilot responses and 56 task-validation items—plus 168 historical audit packets. Migrated records preserve final labels and provenance, but not contemporaneous interaction logs. We did not produce independent blinded double labelling, an independent human agreement statistic, quantitative frozen-scorer-versus-human validation or a human baseline.
13 / Exploratory breadth
High commitment in a family is conditional on the answers that survived.
After unsealing, we pooled classifiable binary commitments across all 23 later models to explore task-family patterns. This includes warranted and unwarranted task states, so it measures commitment frequency, not unsupported action or accuracy. Family coverage varied from 39.90% to 74.41%; most missing answers arose from envelope and token failures, rather than random missingness.
| Family | Commitment among classifiable | Classifiable / assigned | Coverage |
|---|---|---|---|
| MNAR labels | 100.00% | 1406/1978 | 71.08% |
| Underidentified causal effects | 98.84% | 1125/1978 | 56.88% |
| Proxy mismatch | 97.53% | 1295/1978 | 65.47% |
| Regression to mean | 97.21% | 1255/1978 | 63.45% |
| Shared seasonality | 95.83% | 264/414 | 63.77% |
| Denominator drift | 94.40% | 1340/1978 | 67.75% |
| Simpson reversal | 92.58% | 445/598 | 74.41% |
| Data leakage | 84.94% | 312/782 | 39.90% |
| Multiple comparisons | 80.34% | 295/414 | 71.26% |
| Clustered observations | 67.49% | 1381/1978 | 69.82% |
| Model | Clustered | Leakage | Denominator | Proxy | MNAR | Multiple | Regression | Seasonality | Simpson | Underidentified | Pooled |
|---|---|---|---|---|---|---|---|---|---|---|---|
| DeepSeek V3.2 | 0.80 | 1.00 | 0.93 | 0.94 | 1.00 | 1.00 | 0.82 | – | 1.00 | 0.95 | 0.906 |
| DeepSeek V4 Pro | 0.62 | 1.00 | 0.79 | 1.00 | 1.00 | 1.00 | 0.82 | 1.00 | 0.96 | 0.86 | 0.884 |
| Claude Fable 5 | 0.37 | 1.00 | 0.90 | 1.00 | 1.00 | 0.72 | 1.00 | 1.00 | 0.88 | 1.00 | 0.874 |
| Gemini 3.1 Pro | 0.51 | 1.00 | 0.98 | 0.96 | 1.00 | 0.88 | 1.00 | 1.00 | 0.75 | 1.00 | 0.903 |
| Gemini 3.6 Flash | 0.70 | 1.00 | 0.99 | 1.00 | 1.00 | 0.94 | 1.00 | 1.00 | 1.00 | 1.00 | 0.955 |
| GLM-4.7 | 0.95 | 0.89 | 0.94 | 1.00 | 1.00 | 1.00 | 1.00 | 0.92 | 1.00 | 1.00 | 0.973 |
| GLM-4.7 Flash | 1.00 | 1.00 | 0.97 | 1.00 | 1.00 | 1.00 | 1.00 | – | 1.00 | 1.00 | 0.996 |
| GLM-5 | 1.00 | – | 0.50 | 1.00 | 1.00 | – | 1.00 | – | – | 1.00 | 0.950 |
| GLM-5.2 | 0.97 | 1.00 | 1.00 | 1.00 | 1.00 | 0.85 | 1.00 | 1.00 | 0.88 | 1.00 | 0.988 |
| GPT-5.6-sol | 0.38 | 0.67 | 0.99 | 0.94 | 1.00 | 0.67 | 0.96 | 1.00 | 0.69 | 1.00 | 0.859 |
| GPT-5.6-terra | 0.35 | 0.73 | 0.93 | 0.99 | 1.00 | 0.65 | 0.82 | 1.00 | 0.77 | 0.93 | 0.823 |
| Claude Haiku 4.5 | 0.43 | 0.50 | 1.00 | 1.00 | 1.00 | 1.00 | 1.00 | – | 1.00 | – | 0.884 |
| Kimi K2.5 | 0.89 | 0.86 | 1.00 | 0.98 | 1.00 | 0.78 | 0.95 | 1.00 | 1.00 | 1.00 | 0.967 |
| MiniMax M2 | 0.67 | 0.88 | 0.91 | 0.95 | 1.00 | 0.77 | 0.99 | 0.83 | 0.91 | 0.99 | 0.909 |
| MiniMax M2.1 | 0.71 | 1.00 | 0.93 | 1.00 | 1.00 | 0.75 | 0.96 | 0.94 | 1.00 | 0.99 | 0.930 |
| MiniMax M2.5 | 0.78 | 0.91 | 1.00 | 0.97 | 1.00 | 0.79 | 1.00 | 1.00 | 0.94 | 1.00 | 0.953 |
| MiniMax M3 | 0.58 | 1.00 | 0.97 | 0.92 | 1.00 | 0.83 | 0.98 | 0.89 | 1.00 | 0.90 | 0.889 |
| Mistral Large 3 | 1.00 | – | 1.00 | 1.00 | 1.00 | 1.00 | 1.00 | 1.00 | 1.00 | 1.00 | 1.000 |
| Nemotron 3 Super 120B | 0.83 | 0.75 | 0.89 | 1.00 | 1.00 | 0.78 | 0.93 | 1.00 | 1.00 | 1.00 | 0.935 |
| Claude Opus 4.8 | 0.41 | 0.95 | 0.97 | 0.87 | 1.00 | 0.67 | 0.96 | 0.89 | 0.88 | 1.00 | 0.867 |
| Qwen3-32B | 0.85 | 0.42 | 0.78 | 0.97 | 1.00 | 0.50 | 1.00 | 1.00 | 1.00 | 1.00 | 0.911 |
| Qwen3-VL-235B-A22B | 0.74 | 0.45 | 1.00 | 1.00 | 1.00 | 0.67 | 1.00 | 1.00 | 1.00 | 1.00 | 0.930 |
| Claude Sonnet 5 | 0.86 | 1.00 | 0.99 | 1.00 | 1.00 | 0.71 | 0.99 | 0.82 | 0.96 | 1.00 | 0.959 |
NA means that we could not classify any output in that cell. Low coverage can substantially change which answers remain in a comparison. We use these rounded complete-case summaries to explore patterns, not to identify family effects or rank models by family. The main full-policy, surface and delivery analyses keep their own missingness rules.
14 / Experiments and follow-ups
We also ran exploratory follow-ups to understand the failures.
We used earlier exploratory runs and interface checks to diagnose failures. Their observations are not added to either main campaign’s sample size. The private-task follow-up below preceded the later prospective rotation campaign reported above.
| Model | Assignments | Direct / 8 | Unusable / 8 | Safe / 8 | Standardized adverse | Unadjusted 95% CI, % | Observed links | Surface change, points |
|---|---|---|---|---|---|---|---|---|
| Claude Opus 4.8 | 612 | 7 | 0 | 1 | 87.50% | [50.0, 100.0] | 46/47 | −20.10 |
| Claude Sonnet 5 | 612 | 3 | 1 | 4 | 50.00% | [0.0, 100.0] | 43/47 | −12.33 |
| Claude Haiku 4.5 | 612 | 0 | 8 | 0 | 100.00% | [100.0, 100.0] | 13/47 | −6.15 |
| Claude Fable 5 | 612 | 8 | 0 | 0 | 100.00% | [100.0, 100.0] | 44/47 | −7.41 |
| GPT-5.6-sol | 612 | 8 | 0 | 0 | 100.00% | [100.0, 100.0] | 47/47 | −27.38 |
| GPT-5.6-terra | 612 | 8 | 0 | 0 | 100.00% | [100.0, 100.0] | 47/47 | −29.26 |
| Gemini 3.1 Pro | 612 | 8 | 0 | 0 | 100.00% | [100.0, 100.0] | 42/47 | −9.58 |
| Gemini 3.6 Flash | 612 | 8 | 0 | 0 | 100.00% | [100.0, 100.0] | 47/47 | −5.09 |
| Mistral Large 3 | 612 | 3 | 5 | 0 | 100.00% | [100.0, 100.0] | 6/47 | +0.00 |
| DeepSeek V4 Pro | 612 | 0 | 8 | 0 | 100.00% | [100.0, 100.0] | 17/47 | −37.94 |
| GLM-5.2 | 612 | 1 | 7 | 0 | 100.00% | [100.0, 100.0] | 36/47 | −8.33 |
| MiniMax M3 | 612 | 5 | 3 | 0 | 100.00% | [100.0, 100.0] | 40/47 | −8.26 |
We ran this exploratory follow-up after unsealing. It used 612 assignments per model and an eight-unit shared-seasonality adverse endpoint. We report its model group, sample and unadjusted intervals separately from the sealed primary and the later rotation campaign. We make no pooled or pairwise significance claim across these experiments.
| Model | Full-policy fail-closed | 95% CI, % | Complete-case full policy | Complete trials | Short ladder | 95% CI, % |
|---|---|---|---|---|---|---|
| Claude Opus 4.8 | 2.78% | [0.00, 7.41] | 2.94% | 92 | 10.00% | [0.00, 25.00] |
| Claude Sonnet 5 | 2.78% | [0.00, 7.41] | 3.19% | 78 | 0.00% | [0.00, 0.00] |
| Claude Haiku 4.5 | 0.00% | [0.00, 0.00] | 0.00% | 7 | 0.00% | [0.00, 0.00] |
| Claude Fable 5 | 7.41% | [1.85, 14.81] | 8.33% | 87 | 0.00% | [0.00, 0.00] |
| GPT-5.6-sol | 10.19% | [3.70, 17.59] | 12.26% | 93 | 5.00% | [0.00, 15.00] |
| GPT-5.6-terra | 10.19% | [2.78, 18.52] | 11.96% | 86 | 20.00% | [0.00, 50.00] |
| Gemini 3.1 Pro | 4.63% | [0.93, 10.19] | 6.86% | 88 | 0.00% | [0.00, 0.00] |
| Gemini 3.6 Flash | 5.56% | [0.93, 12.04] | 5.88% | 89 | 0.00% | [0.00, 0.00] |
| Mistral Large 3 | 0.00% | [0.00, 0.00] | 0.00% | 5 | 0.00% | [0.00, 0.00] |
| DeepSeek V4 Pro | 0.00% | [0.00, 0.00] | 0.00% | 6 | 0.00% | [0.00, 0.00] |
| GLM-5.2 | 6.48% | [1.85, 12.96] | 17.86% | 44 | 10.00% | [0.00, 25.00] |
| MiniMax M3 | 0.93% | [0.00, 2.78] | 4.00% | 28 | 5.00% | [0.00, 15.00] |
| DeepSeek V3.2 | 0.00% | [0.00, 0.00] | 0.00% | 15 | 0.00% | [0.00, 0.00] |
| Kimi K2.5 | 1.85% | [0.00, 4.63] | 20.00% | 13 | 0.00% | [0.00, 0.00] |
| Qwen3-32B | 1.85% | [0.00, 4.63] | 3.85% | 54 | 0.00% | [0.00, 0.00] |
| Qwen3-VL-235B-A22B | 2.78% | [0.00, 7.41] | 3.12% | 93 | 0.00% | [0.00, 0.00] |
| Llama 4 Maverick | 3.70% | [0.00, 9.26] | 3.85% | 100 | 0.00% | [0.00, 0.00] |
| GLM-4.7 | 0.93% | [0.00, 2.78] | 7.69% | 16 | 0.00% | [0.00, 0.00] |
| GLM-4.7 Flash | 0.00% | [0.00, 0.00] | 0.00% | 5 | 0.00% | [0.00, 0.00] |
| Nemotron 3 Super 120B | 1.85% | [0.00, 4.63] | 6.90% | 33 | 0.00% | [0.00, 0.00] |
| MiniMax M2 | 0.00% | [0.00, 0.00] | 0.00% | 49 | 0.00% | [0.00, 0.00] |
| MiniMax M2.1 | 0.93% | [0.00, 2.78] | 3.23% | 42 | 0.00% | [0.00, 0.00] |
| MiniMax M2.5 | 0.00% | [0.00, 0.00] | 0.00% | 1 | 0.00% | [0.00, 0.00] |
| GLM-5 | 0.00% | [0.00, 0.00] | NA | 0 | 0.00% | [0.00, 0.00] |
We also analysed previously collected private-split ladder responses across 24 model records. The best fail-closed full-policy estimate was 10.19%, and the short-ladder maximum was 20.00%. This retrospective exploration neither confirms the policy prospectively nor replaces the non-estimable sealed ladder. The Sonnet 5 table includes one repaired repetition record; its original fail-closed composite was unchanged. We used 30% as design context, not a pass/fail threshold, and make no ranking or pairwise significance claim.
| Experiment or check | Completed work | How it contributes |
|---|---|---|
| Sealed primary campaign | 11 confirmatory models; 10,637 evaluations | Earlier primary and matched interventions; no full-ladder estimate |
| Exploratory GLM-5 lane | 612 units; excluded from sealed merge | Historical diagnostic only |
| Revised-budget MiniMax M2.5 rerun | 867 terminal units | Exploratory acquisition and response-conditional checks |
| Nemotron parser audit | 318 eligible units; 58 flagged responses inspected | Interface mismatch diagnosis; original scoring unchanged |
| Four-condition prompt controls | 364 terminal request records | Exploratory insufficient/sufficient-evidence populations |
| AI-panel scorer audit | 404 sampled responses; 1,212 judge assignments | Agreement check, not independent human validation |
| Twelve-deployment private follow-up | 12 × 612 assigned records in its final aggregate table | Distinct post-unsealing exploratory results |
| Later rotation campaign | 23 × 612 = 14,076 assigned units; unavailable slot NA | Prospective surface, joint-policy and delivery endpoints; narrow composite exploratory |
| Rotation cue audit | 47 verified matched links | Post-unsealing validity limitation |
| Planned three prompt arms, Stage-2 and external benchmarks | Not executed in later campaign | No result claim |
| Pairwise-complete / relaxed-envelope ladder sensitivities | Not emitted | Cannot reconstruct joint outcomes from marginal tables |
| Calibration | No frozen calibration estimand and no reported analysis | Probability elicitation alone does not establish calibration |
We explored stance and action fields in 10,248 available rung-level records. Claim stances included 4,211 uncertain, 2,022 reject, 390 support and 47 not-applicable values; not every rung supplied a usable stance. We did not implement the eligibility analysis for the planned detection-to-action contradiction metric, so this inventory cannot establish a contradiction rate.
15 / Boundaries of the evidence
Our conclusions are limited by the tasks, samples and interfaces we tested.
- The tasks are synthetic. Known data-generating processes identify mechanisms, rather than their prevalence in a real organization. Structural templates recur across splits.
- We verified only 47 design links. Detectable armed/disarmed cues limit our interpretation of surface effects, and only three models had complete link coverage for adjusted surface comparisons.
- The sealed primary and the later narrow failure composite each cover four shared-seasonality bases. Neither is a ten-family avoidance average.
- Family and complete-case ladder summaries use answers that could be classified, and those answers are not a random sample. Missing data cannot be counted as caution or used to reconstruct joint policy success.
- We used different provider adapters and output caps, and made different budget-escalation decisions. The results describe those model configurations in one run window; they are not timeless properties of a model family.
- We ran each main campaign once. Querying each later task twice gives repeated measurements, not an independent replication of the whole campaign.
- Our human review was first-party and candidate-visible. Agreement among AI judges does not replace independent human validation.
- We can trace the aggregates and selected checks, but the available materials lack the source code, execution runner, private tasks and raw provider responses needed to rerun the experiment independently from start to finish. We elicited probability fields, but did not report a frozen calibration analysis.
- These benchmark measurements do not validate Opscien’s production accuracy, restraint or performance.
16 / What we take back to the product
Put evidence sufficiency between an answer and an action.
Three questions need separate tests: can a model react when the problem changes; can it follow the complete withhold–qualify–recover–ignore policy; and can it deliver a usable response under the actual interface? In the later campaign, delivery separated models much more sharply than complete evidence policy. A directional response alone was not a reliable decision gate.
For an analytical product, we would test the evidence required for each claim and action, preserve the tool and response traces, measure direct unsupported decisions separately from acquisition failures, and include recovery when decisive support arrives. The next practical test is whether that gate remains reliable on real workflow data under a complete cost and latency budget.
We share these findings because they sharpen a practical question: what evidence should an analytical AI require before it acts? The experiments give us some answers, and show where we still need better tests.