
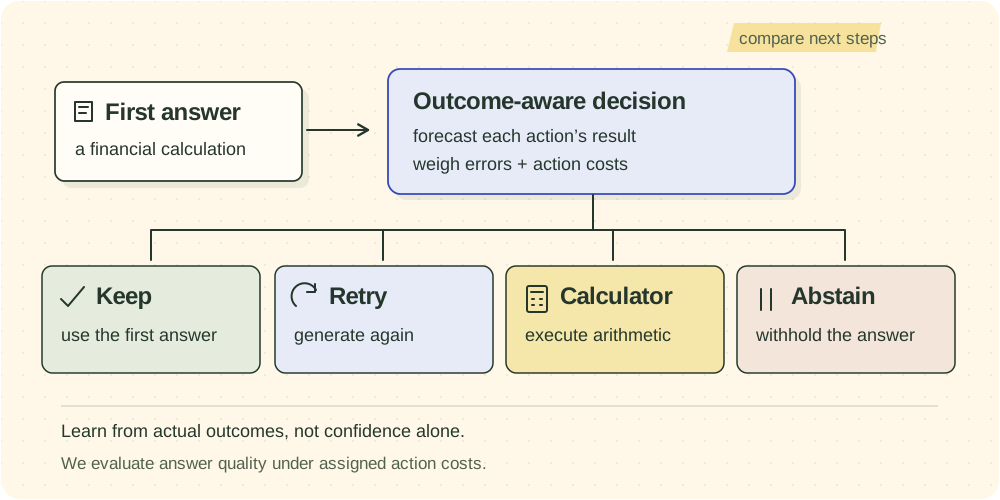
01 / Define the decision
“Is this answer right?” and “What should happen next?” are different questions.
A model answers a question about a financial report. We can keep the answer, generate a fresh one, run a calculation, or abstain. Low confidence in the first answer does not tell us which alternative will help. A second attempt may repeat the error. A calculator may compute the wrong expression perfectly. An intervention can also spoil an answer that was already correct.
For each action a, the useful forecast is pa: the probability that its final answer will be correct, given the question and available signals. These are separate action outcomes, so their probabilities do not have to sum to one. Once we have those estimates, we can apply the cost of an error and the cost of the action.
Expected utility: U(a) = pa + (1 − pa)uwrong − m ca
A correct answer is worth +1; uwrong is the negative value assigned to an error; ca is the route’s assigned cost; and m scales that cost. Abstention has its own fixed utility. The decision rule chooses the eligible action with the highest expected value.
We evaluated 27 settings: error utilities −1, −2 or −4; abstention utilities −0.2, −0.1 or 0; and cost multipliers 0.5, 1 or 2. Keep had zero incremental cost, retry 0.10 and calculator 0.25. These are illustrative decision weights. They do not represent measured electricity, dollars, tokens or latency. The offline simulations also omitted the cost of acquiring confidence signals, including additional model calls.
02 / Make the comparison measurable
We tested local and hosted models.
The local models let us measure complete action outcomes, exact token statistics and selected hidden-state snapshots. We queried the hosted models through provider interfaces, measuring first answers, independent retries and calculator expressions. The table lists the models we actually ran.
| Model | Experiment group | Coverage per model |
|---|---|---|
| Qwen3.5-9B | Local · core | 1,000 questions; 10,600 terminal trials |
| Gemma-4-12B-IT | Local · core | 1,000 questions; 10,600 terminal trials |
| Phi-4 | Local · core | 1,000 questions; 10,600 terminal trials |
| Qwen3-32B | Local · extension | 1,000 questions; 10,600 terminal trials |
| Gemma-4-31B-IT | Local · extension | 1,000 questions; 10,600 terminal trials |
| Claude Opus 4.8 | Hosted experiment | 300 questions; 3,900 scheduled request units |
| GPT-5.6-sol | Hosted experiment | 300 questions; 3,900 scheduled request units |
| Gemini 3.1 Pro Preview | Hosted experiment | 300 questions; 3,900 scheduled request units |
| Grok 4.5 | Hosted experiment | 300 questions; 3,900 scheduled request units |
| Kimi-K2.6 | Hosted experiment | 300 questions; 3,900 scheduled request units |
| GLM-5.1 | Hosted experiment | 300 questions; 3,900 scheduled request units |
| DeepSeek-V4-Pro | Hosted experiment | 300 questions; 3,900 scheduled request units |
The three core models contributed 31,800 local trials. The two later extensions contributed 21,200 under the same reduced protocol. For hosted models, we retained the names requested in our run records. Those names identify the deployed model together with the collector we used; they do not guarantee that a provider always serves the same frozen weights under a given name.
Questions, curation and held-out separation
We selected 500 executable numerical questions from FinQA and 500 from TAT-QA. Both combine financial-report text and tables with arithmetic; TAT-QA also records some displayed numbers separately from their scale. We restricted the selection to financial arithmetic with validated derivations and visible operands. Our results apply to this curated subset; we did not test either benchmark’s full distribution.
| Dataset | Training | Validation | Held out | Total |
|---|---|---|---|---|
| FinQA | 100 | 100 | 300 | 500 |
| TAT-QA | 100 | 100 | 300 | 500 |
We drew from 8,279 FinQA records and 4,657 TAT-QA arithmetic records whose reference derivations reproduced the gold answer. For TAT-QA, we excluded 971 unsafe or mismatched derivations and 1,332 cases whose operands could not be traced to the visible context. We stratified selection by operation family, table/text/hybrid evidence and context length, reserved test sources first, excluded pilot and near-duplicate contexts, and capped examples from one source at two wherever feasible. Gold-derived strata guided curation but were never shown to a model at inference.
The local training, validation and held-out splits contained 183, 171 and 427 source groups respectively. All five models received the same 600 held-out questions. This gave us 3,000 model–question pairs, not 3,000 unique questions.
We kept questions from the same financial report or context in one split and excluded held-out labels from fitting and tuning. The five local models came from three families: Qwen3.5-9B, Gemma-4-12B-IT and Phi-4 formed the core group; we added Qwen3-32B and Gemma-4-31B-IT later. We ran them in unquantized BF16 with pinned model and tokenizer identities and did not fine-tune their weights. The aligned core outcome and feature runs used RTX A6000 hardware; extension outcomes used RTX PRO 6000 Blackwell and extension held-out features used H200. The copied core held-out outcome directory lacked a device receipt, so we relied on the run ledger for that hardware attribution. We could not reconstruct an exact GPU-hour total across these heterogeneous runs.
| Route | Protocol |
|---|---|
| Keep | Return the original structured answer, generated deterministically at temperature 0 and top-p 1. |
| Retry | Generate an independent answer from the original question and context. The retry never sees or critiques the first answer. |
| Calculator | Generate a restricted expression from the original task, execute it with a Decimal-based evaluator, then return the result or error to the model for a final-answer turn. Neither calculator turn receives the first answer. |
| Abstain | Assign a fixed utility offline. No generated answer is needed. |
Retries, calculator interventions and consistency samples used temperature 0.7 and top-p 0.95, with a 512-token output cap and 16,384-token input cap. A structured call could receive at most one format-only repair. We changed sampling settings, computation and tool prompting together. These comparisons therefore measure complete protocols, without isolating any one causal mechanism.
The evaluator accepted decimal arithmetic and one-argument percent, thousands, millions and billions helpers. It rejected other calls and expressions outside its bounded grammar: at most 128 syntax nodes, depth 24, 64 operations and a 0.25-second evaluation budget, with Decimal precision 50. An expression-format failure ended the trial; an evaluator error was passed to the model, whose final answer could still earn credit. Our prompt named the helpers without defining their multipliers. That omission became important in the scale failure we examine below.
For each physical generation, we derived a distinct deterministic seed from its coordinates in the run. We counterbalanced action order and vector/scalar elicitation order. Format repair ran at temperature 0 and top-p 1, saw the invalid response and schema error, and received no new task information. We instructed the model to preserve the substance while fixing the format, but could not guarantee that it did so.
Each model produced 400 learning tasks × (1 first answer + 3 retries + 3 calculator trials), and 600 held-out tasks × (1 + 6 + 6). Across five models, that is 53,000 terminal trials, including 39,000 held-out outcomes. We count a trial as one scored action outcome. It may require several model calls: calculator trials normally use two turns, and format repair can add calls.
What we measured for hosted models
We gave all seven hosted models the same 300 held-out questions: 152 FinQA and 148 TAT-QA. For each model and question, we requested one first answer, six independent retries and six expressions: 300 + 1,800 + 1,800 = 3,900 request units per model. These 300 questions were a deterministic subset of the 600 local held-out questions, so they do not add independent data.
Our planned stratified subset selection looked for a field missing from the stored stratum records. All questions consequently fell into one bucket, and selection used a deterministic shuffle within each phase. We prepared a 200-question learning subset but did not use it. For the hosted models, we collected no local-style action forecasts, P(True), P(IK), native choices or routing measurements, and did not complete the planned consistency-feature analysis.
We included delegation to another model in the forecasts and choice menu, but never ran the delegated outcomes. We therefore excluded delegation from the four-action utility simulation and bounded its missing outcomes when comparing the controller with native choices.
03 / Score the whole outcome
Improvement means repairs minus damage.
A fixed numeric verifier compared final answers with reference values; we did not use an AI judge. It allowed absolute tolerance 10−6 and relative tolerance 10−3. Percent rescaling required an explicit percent marker in the answer or reference, or trusted percent metadata. Unusable outputs remained in the denominator and counted as wrong.
Thirteen held-out trials ended without a usable answer and 480 generated answers could not be verified. All 493 failures—1.264% of the 39,000 held-out outcomes—were retained. We averaged the replicates, gave tasks equal weight within each report group, and weighted report groups, datasets and models equally.
| Model | Learning raw action failures | Held-out raw action failures | Held-out generated but unverifiable answers |
|---|---|---|---|
| Qwen3.5-9B | 2 | 0 | 31 |
| Gemma-4-12B-IT | 1 | 1 | 212 |
| Phi-4 | 8 | 6 | 91 |
| Qwen3-32B | 6 | 6 | 39 |
| Gemma-4-31B-IT | 0 | 0 | 107 |
Learning also retained 116 generated but unverifiable answers alongside 17 raw action failures. Held-out raw failures were response-parse failures or invalid calculator calls; all thirteen and the 480 unverifiable terminal answers counted as zero. Infrastructure failures prevented some planned models from completing the experiment. We did not assign artificial outcomes to those missing runs.
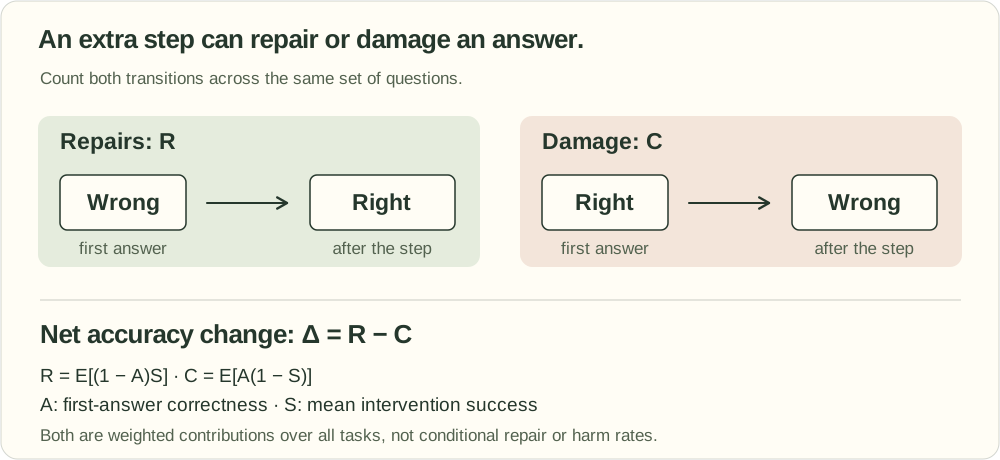
R = E[(1 − A)S] · C = E[A(1 − S)] · Δ = R − C
Here A is first-answer correctness (0 or 1), and S is the intervention’s mean success across replicates for that task. R and C are weighted contributions over all tasks, rather than conditional success rates among only wrong or right first answers.
We estimated action-effect and routing uncertainty with 10,000 paired bootstrap resamples of source report groups. Internal-signal contrasts used 2,000 grouped draws and 32 shuffled-training-label checks. For hosted models, we used 10,000 source-group draws with equal dataset weighting. These intervals describe sampling uncertainty for the models we tested. The ten local dataset-interaction tests used two-sided bootstrap tails; the forty paired model-effect contrasts used clustered sign-flip tests. Holm correction was applied separately to these two families. Intervals for the hosted models are exploratory and unadjusted.
A percentage is an accuracy rate; a percentage point is a difference between rates. For example, a change from 41.75% to 36.33% is −5.42 points. Utility scores and mean absolute error (MAE) are different metrics and retain their own scales below.
04 / What extra steps actually changed
A fresh answer did not always improve accuracy.
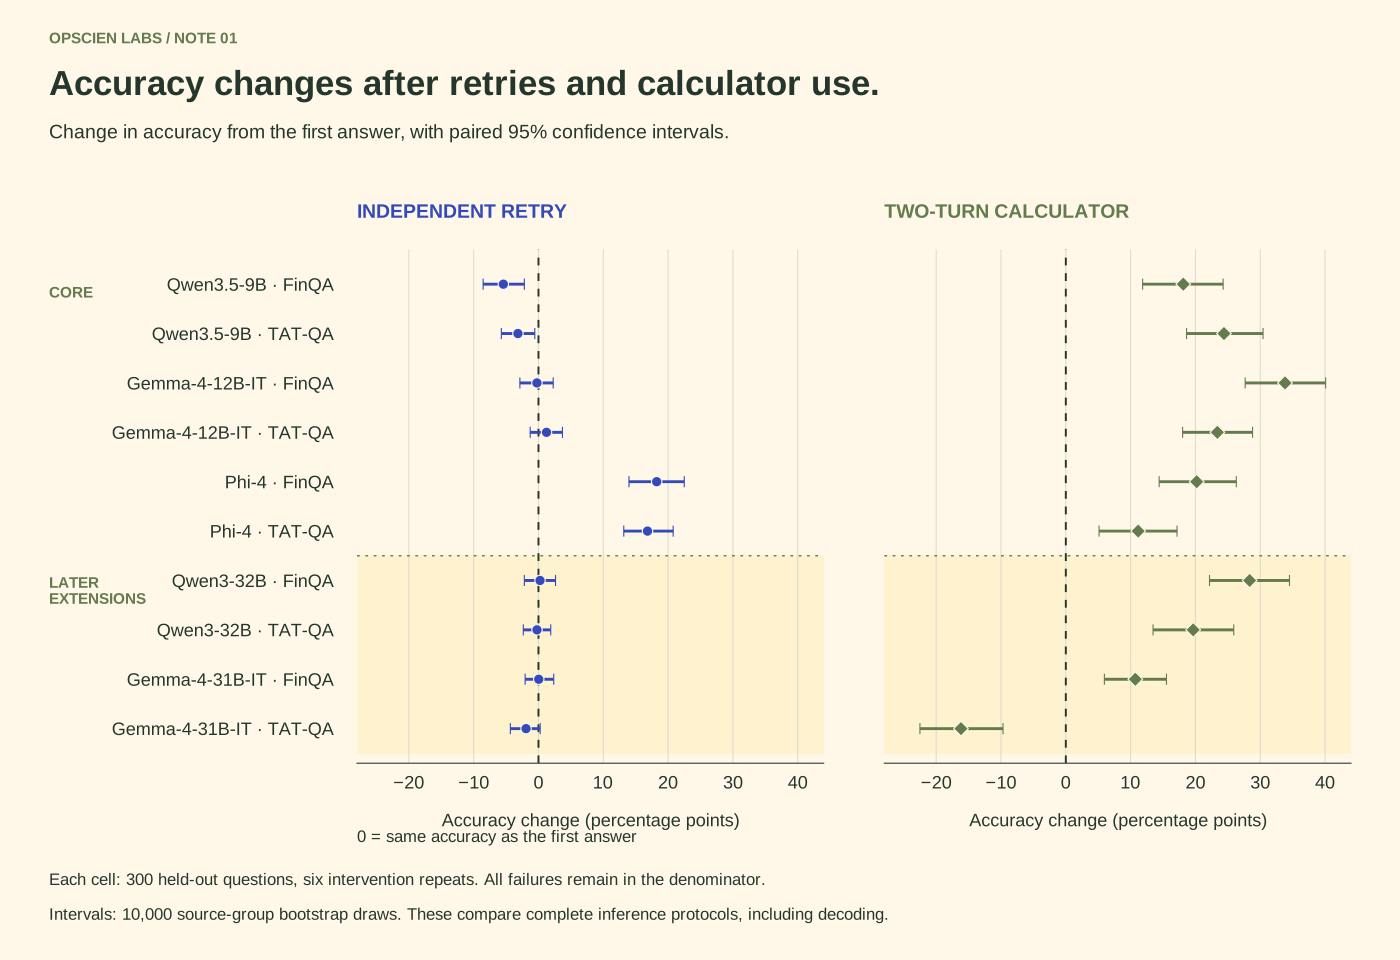
On FinQA, a fresh retry improved Phi-4 by 18.24 accuracy points and reduced Qwen3.5-9B by 5.42 points. Phi-4’s repair contribution was 21.08 points versus 2.83 points of damage; Qwen’s was 3.88 versus 9.30. The net uses unrounded values, so subtracting displayed terms can differ by 0.01.
Across the five local models, retry gained 2.56 points on average (95% CI 1.65 to 3.51). The calculator route gained 17.36 points (14.84 to 19.88), with positive changes in nine of ten model–dataset pairs. Nine positive comparisons does not mean 90% answer accuracy. One calculator combination lost 16.18 points.
Absolute accuracy for every completed local combination
| Model | Dataset | Keep first answer | Independent retry | Two-turn calculator |
|---|---|---|---|---|
| Qwen3.5-9B | FinQA | 41.75% | 36.33% | 59.87% |
| Qwen3.5-9B | TAT-QA | 60.63% | 57.47% | 85.03% |
| Gemma-4-12B-IT | FinQA | 35.68% | 35.44% | 69.50% |
| Gemma-4-12B-IT | TAT-QA | 66.52% | 67.76% | 89.89% |
| Phi-4 | FinQA | 30.58% | 48.83% | 50.77% |
| Phi-4 | TAT-QA | 45.02% | 61.84% | 56.18% |
| Qwen3-32B | FinQA | 33.98% | 34.22% | 62.34% |
| Qwen3-32B | TAT-QA | 61.09% | 60.86% | 80.73% |
| Gemma-4-31B-IT | FinQA | 62.86% | 62.90% | 73.58% |
| Gemma-4-31B-IT | TAT-QA | 79.86% | 77.94% | 63.69% |
Paired changes and statistical uncertainty
| AI system | Questions | First answer | Retry change [95% CI] | Calculator change [95% CI] |
|---|---|---|---|---|
| Qwen3.5-9B | FinQA | 41.75% | −5.42 [−8.54, −2.18] | +18.12 [+11.85, +24.27] |
| Qwen3.5-9B | TAT-QA | 60.63% | −3.17 [−5.73, −0.57] | +24.40 [+18.63, +30.43] |
| Gemma-4-12B-IT | FinQA | 35.68% | −0.24 [−2.87, +2.27] | +33.82 [+27.67, +40.09] |
| Gemma-4-12B-IT | TAT-QA | 66.52% | +1.24 [−1.28, +3.70] | +23.38 [+18.02, +28.81] |
| Phi-4 | FinQA | 30.58% | +18.24 [+13.96, +22.49] | +20.19 [+14.40, +26.30] |
| Phi-4 | TAT-QA | 45.02% | +16.82 [+13.16, +20.78] | +11.16 [+5.13, +17.16] |
| Qwen3-32B | FinQA | 33.98% | +0.24 [−2.18, +2.63] | +28.36 [+22.17, +34.51] |
| Qwen3-32B | TAT-QA | 61.09% | −0.23 [−2.34, +1.89] | +19.65 [+13.46, +25.91] |
| Gemma-4-31B-IT | FinQA | 62.86% | +0.04 [−2.06, +2.35] | +10.72 [+5.95, +15.53] |
| Gemma-4-31B-IT | TAT-QA | 79.86% | −1.92 [−4.34, +0.26] | −16.18 [−22.51, −9.69] |
First-answer values are accuracy percentages. Action effects and their 95% intervals are changes in percentage points relative to keeping that answer. Each cell covers 300 held-out questions; Qwen3-32B and Gemma-4-31B-IT are later extensions.
How much repair came with how much damage?
We separated repairs from damage in every model–dataset combination. These contributions are weighted over all questions; they are not conditional rates among only wrong or correct first answers. “Damage” means a replacement route produced a wrong answer on a question whose first answer was right.
| Model | Dataset | Retry repairs | Retry damage | Retry net | Calculator repairs | Calculator damage | Calculator net |
|---|---|---|---|---|---|---|---|
| Qwen3.5-9B | FinQA | 3.88 | 9.30 | −5.42 | 27.02 | 8.90 | +18.12 |
| Qwen3.5-9B | TAT-QA | 3.92 | 7.09 | −3.17 | 29.00 | 4.60 | +24.40 |
| Gemma-4-12B-IT | FinQA | 3.28 | 3.52 | −0.24 | 36.65 | 2.83 | +33.82 |
| Gemma-4-12B-IT | TAT-QA | 4.00 | 2.75 | +1.24 | 25.15 | 1.77 | +23.38 |
| Phi-4 | FinQA | 21.08 | 2.83 | +18.24 | 27.51 | 7.32 | +20.19 |
| Phi-4 | TAT-QA | 19.42 | 2.60 | +16.82 | 24.55 | 13.39 | +11.16 |
| Qwen3-32B | FinQA | 3.11 | 2.87 | +0.24 | 32.85 | 4.49 | +28.36 |
| Qwen3-32B | TAT-QA | 2.98 | 3.21 | −0.23 | 26.66 | 7.01 | +19.65 |
| Gemma-4-31B-IT | FinQA | 2.51 | 2.47 | +0.04 | 14.72 | 4.00 | +10.72 |
| Gemma-4-31B-IT | TAT-QA | 1.36 | 3.28 | −1.92 | 7.96 | 24.13 | −16.18 |
Model differences and dataset interactions
Seventeen of forty paired model-effect contrasts remained supported after Holm correction. Only the Gemma-4-31B-IT calculator dataset interaction survived correction over the ten interaction tests: −26.90 points [95% CI −35.11, −18.99], adjusted p = 0.002. A confidence interval excluding zero before correction does not automatically establish a result after correction.
All ten dataset-interaction tests
| Model | Action | Interaction | 95% CI | Holm-adjusted p |
|---|---|---|---|---|
| Qwen3.5-9B | Retry | +2.25 | [−1.85, +6.37] | 1.000 |
| Qwen3.5-9B | Calculator | +6.27 | [−2.15, +14.95] | 0.896 |
| Gemma-4-12B-IT | Retry | +1.49 | [−2.08, +5.04] | 1.000 |
| Gemma-4-12B-IT | Calculator | −10.44 | [−18.70, −2.23] | 0.117 |
| Phi-4 | Retry | −1.43 | [−7.26, +4.32] | 1.000 |
| Phi-4 | Calculator | −9.02 | [−17.76, −0.55] | 0.302 |
| Qwen3-32B | Retry | −0.47 | [−3.68, +2.66] | 1.000 |
| Qwen3-32B | Calculator | −8.71 | [−17.41, −0.03] | 0.347 |
| Gemma-4-31B-IT | Retry | −1.96 | [−5.31, +1.15] | 1.000 |
| Gemma-4-31B-IT | Calculator | −26.90 | [−35.11, −18.99] | 0.002 |
All forty paired model-effect contrasts
Each row compares the action effect of model A with model B on the same dataset. Qwen9 = Qwen3.5-9B; Gemma12 = Gemma-4-12B-IT; Phi4 = Phi-4; Qwen32 = Qwen3-32B; Gemma31 = Gemma-4-31B-IT. The intervals are paired source-group bootstrap intervals; the p-values adjust the complete forty-test family.
| Action | Model A − model B | Effect difference | 95% CI | Holm-adjusted p |
|---|---|---|---|---|
| Retry | Qwen9 − Gemma12 | −5.18 | [−9.51, −0.85] | 0.337 |
| Retry | Qwen9 − Phi4 | −23.67 | [−29.21, −18.16] | 0.004 |
| Retry | Qwen9 − Qwen32 | −5.66 | [−9.75, −1.74] | 0.145 |
| Retry | Qwen9 − Gemma31 | −5.46 | [−9.47, −1.50] | 0.160 |
| Retry | Gemma12 − Phi4 | −18.49 | [−23.50, −13.55] | 0.004 |
| Retry | Gemma12 − Qwen32 | −0.49 | [−4.09, +3.24] | 1.000 |
| Retry | Gemma12 − Gemma31 | −0.28 | [−3.72, +3.03] | 1.000 |
| Retry | Phi4 − Qwen32 | +18.00 | [+13.15, +22.86] | 0.004 |
| Retry | Phi4 − Gemma31 | +18.20 | [+13.43, +23.02] | 0.004 |
| Retry | Qwen32 − Gemma31 | +0.20 | [−2.95, +3.36] | 1.000 |
| Calculator | Qwen9 − Gemma12 | −15.70 | [−23.14, −8.05] | 0.005 |
| Calculator | Qwen9 − Phi4 | −2.06 | [−10.15, +6.23] | 1.000 |
| Calculator | Qwen9 − Qwen32 | −10.23 | [−18.37, −2.06] | 0.229 |
| Calculator | Qwen9 − Gemma31 | +7.40 | [−0.28, +14.60] | 0.728 |
| Calculator | Gemma12 − Phi4 | +13.63 | [+6.35, +21.16] | 0.010 |
| Calculator | Gemma12 − Qwen32 | +5.46 | [−1.58, +12.78] | 1.000 |
| Calculator | Gemma12 − Gemma31 | +23.10 | [+16.42, +29.69] | 0.004 |
| Calculator | Phi4 − Qwen32 | −8.17 | [−15.49, −1.09] | 0.458 |
| Calculator | Phi4 − Gemma31 | +9.47 | [+2.63, +16.59] | 0.168 |
| Calculator | Qwen32 − Gemma31 | +17.64 | [+10.44, +24.76] | 0.004 |
| Action | Model A − model B | Effect difference | 95% CI | Holm-adjusted p |
|---|---|---|---|---|
| Retry | Qwen9 − Gemma12 | −4.41 | [−7.69, −1.13] | 0.194 |
| Retry | Qwen9 − Phi4 | −19.98 | [−24.51, −15.42] | 0.004 |
| Retry | Qwen9 − Qwen32 | −2.94 | [−6.30, +0.49] | 1.000 |
| Retry | Qwen9 − Gemma31 | −1.24 | [−4.68, +2.45] | 1.000 |
| Retry | Gemma12 − Phi4 | −15.57 | [−20.10, −11.24] | 0.004 |
| Retry | Gemma12 − Qwen32 | +1.47 | [−1.77, +4.52] | 1.000 |
| Retry | Gemma12 − Gemma31 | +3.17 | [−0.34, +6.64] | 1.000 |
| Retry | Phi4 − Qwen32 | +17.04 | [+12.82, +21.42] | 0.004 |
| Retry | Phi4 − Gemma31 | +18.74 | [+14.37, +23.23] | 0.004 |
| Retry | Qwen32 − Gemma31 | +1.70 | [−1.28, +4.83] | 1.000 |
| Calculator | Qwen9 − Gemma12 | +1.02 | [−6.15, +8.14] | 1.000 |
| Calculator | Qwen9 − Phi4 | +13.24 | [+5.50, +20.93] | 0.017 |
| Calculator | Qwen9 − Qwen32 | +4.75 | [−2.71, +12.07] | 1.000 |
| Calculator | Qwen9 − Gemma31 | +40.57 | [+32.16, +49.10] | 0.004 |
| Calculator | Gemma12 − Phi4 | +12.22 | [+4.52, +19.91] | 0.062 |
| Calculator | Gemma12 − Qwen32 | +3.73 | [−3.47, +11.01] | 1.000 |
| Calculator | Gemma12 − Gemma31 | +39.56 | [+32.39, +46.79] | 0.004 |
| Calculator | Phi4 − Qwen32 | −8.48 | [−16.82, −0.26] | 0.664 |
| Calculator | Phi4 − Gemma31 | +27.34 | [+18.74, +35.94] | 0.004 |
| Calculator | Qwen32 − Gemma31 | +35.82 | [+27.41, +43.97] | 0.004 |
05 / Hosted models
Seven models, three measured outcomes.
We asked each hosted model for a first answer, six fresh retries and six calculator expressions on the common 300-question subset, containing 296 numeric and four Boolean targets. We scheduled 27,300 request units. Six models returned all 3,900 records; GPT-5.6-sol returned 3,899 because one expression response was missing. In total, we received 27,299 raw records, of which 27,281 contained nonempty output. We kept the scheduled requests as the denominator.
First-answer and retry accuracy
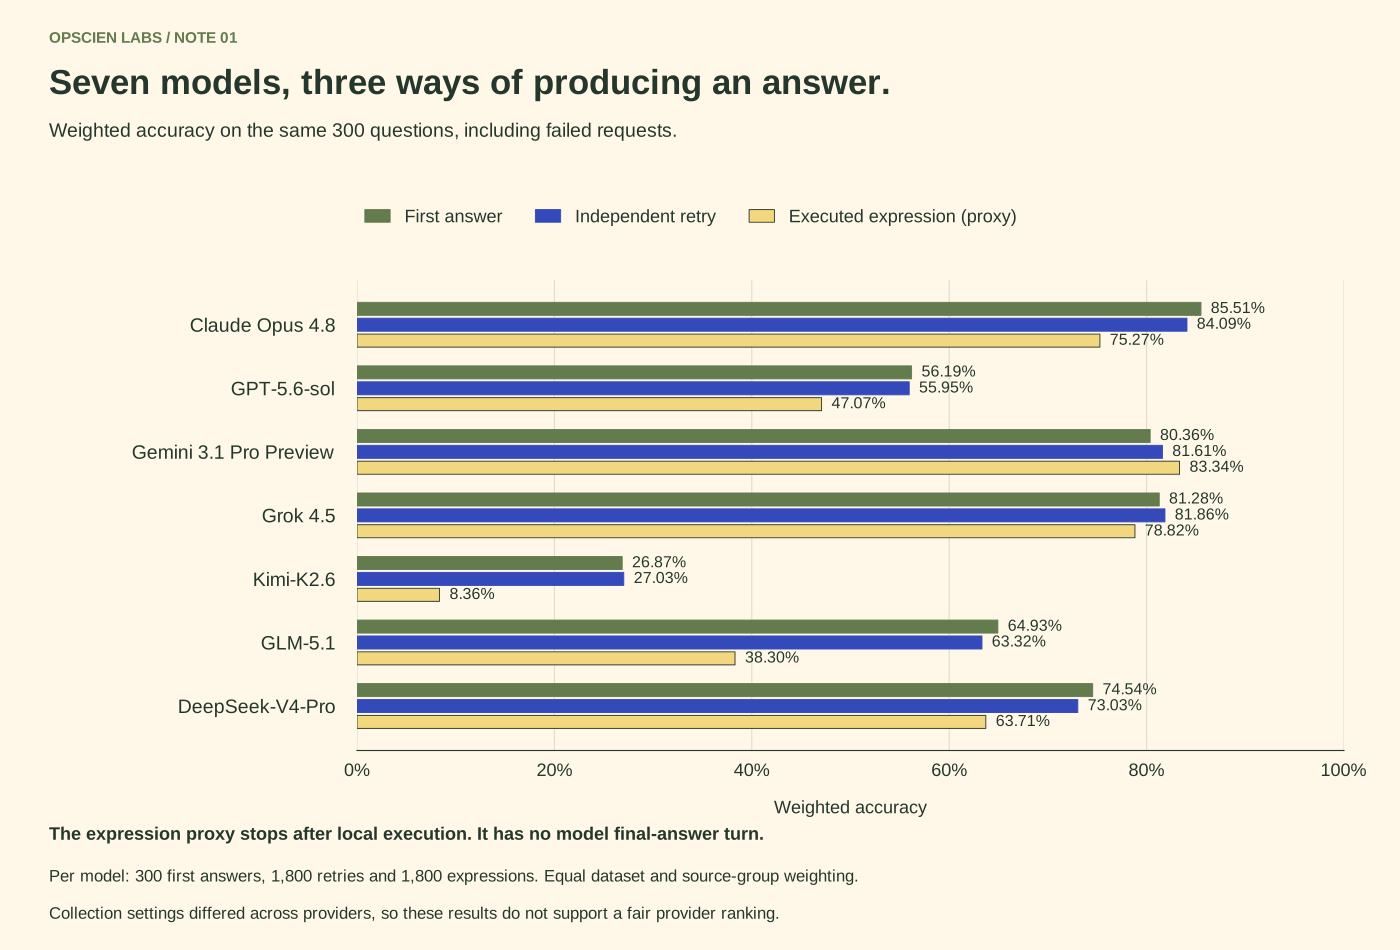
We scored the terminal answers with equal dataset and source-group weighting and included failures. A blind retry changed accuracy by −1.61 to +1.25 points across these models. Only the Opus interval excluded zero before correction for multiple comparisons; the intervals below remain exploratory and unadjusted.
| Model | First-answer accuracy | Retry accuracy | Retry change [95% CI] |
|---|---|---|---|
| Claude Opus 4.8 | 85.51% | 84.09% | −1.42 [−2.96, −0.13] |
| GPT-5.6-sol | 56.19% | 55.95% | −0.24 [−2.63, +1.96] |
| Gemini 3.1 Pro Preview | 80.36% | 81.61% | +1.25 [−0.79, +3.38] |
| Grok 4.5 | 81.28% | 81.86% | +0.58 [−0.70, +2.10] |
| Kimi-K2.6 | 26.87% | 27.03% | +0.16 [−3.29, +3.71] |
| GLM-5.1 | 64.93% | 63.32% | −1.61 [−5.25, +2.02] |
| DeepSeek-V4-Pro | 74.54% | 73.03% | −1.51 [−4.91, +1.95] |
What happened to the calculator expressions?
We stopped collection after requesting an expression. In a later strict rescore, we executed each scoreable expression locally and compared its raw result with the reference answer. We never returned that result to the hosted model for a final-answer turn. The table therefore reports expression-result accuracy; it does not measure the completed calculator workflow and cannot be compared directly with the two-turn local calculator result.
| Model | Expression-result accuracy | Proxy change, points | 95% CI |
|---|---|---|---|
| Claude Opus 4.8 | 75.27% | −10.24 | [−14.82, −5.62] |
| GPT-5.6-sol | 47.07% | −9.12 | [−15.90, −2.02] |
| Gemini 3.1 Pro Preview | 83.34% | +2.98 | [−0.45, +6.46] |
| Grok 4.5 | 78.82% | −2.46 | [−5.70, +0.72] |
| Kimi-K2.6 | 8.36% | −18.51 | [−23.36, −13.75] |
| GLM-5.1 | 38.30% | −26.63 | [−32.34, −20.88] |
| DeepSeek-V4-Pro | 63.71% | −10.83 | [−15.12, −6.53] |
For the strict rescore, we used the frozen restricted parser, Decimal evaluator and percent convention, including percent(x) = 0.01x. Earlier scorer variants used a different percent factor, broader expression grammar and number extraction. We withdrew their hybrid deltas. Repeating the strict calculation for four models with equal-item weighting and scheduled denominators gave proxy changes of −10.11 points for Opus, −9.17 for GPT, +3.06 for Gemini and −2.50 for Grok. The small difference reflects weighting.
Could the returned output be scored at all?
Across all three request types, 6,033 of 27,300 scheduled units (22.10%) were not scoreable. We counted empty output, format problems, restricted-expression failures and terminal values the fixed checker could not verify. A wrong but parseable number was still scoreable, so these percentages measure a different failure mode from accuracy.
| Model | First answer | Retry | Expression |
|---|---|---|---|
| Claude Opus 4.8 | 2.00% | 3.89% | 0.00% |
| GPT-5.6-sol | 27.00% | 28.61% | 0.11% |
| Gemini 3.1 Pro Preview | 1.00% | 0.78% | 0.83% |
| Grok 4.5 | 4.00% | 3.61% | 0.33% |
| Kimi-K2.6 | 72.00% | 71.28% | 90.44% |
| GLM-5.1 | 27.00% | 28.17% | 45.61% |
| DeepSeek-V4-Pro | 11.67% | 14.39% | 23.00% |
The six archived non-GPT collectors used one-shot prompt-only JSON, without an enforced schema, repair or explicit sampling and reasoning controls. Their output cap was 1,024 tokens. Gemini used its native API. We could not recover the exact GPT request generator. Kimi, GLM and DeepSeek often reached the cap, but missing finish-reason metadata means we cannot identify every such case as confirmed truncation.
We measured each hosted model together with its collection and scoring interface. Because those configurations differed, we cannot turn these results into a provider-quality ranking. We found small, mixed retry changes and substantial interface-dependent failure. We did not establish the effect of a full hosted calculator workflow, confidence-based routing for those models, or provider access compared with local internal access.
06 / Investigate the calculator reversal
A correct calculation can still be the wrong answer.
Gemma-4-31B-IT’s calculator effect switched from +10.72 points on FinQA to −16.18 on TAT-QA. The latter combined 7.96 points of repairs with 24.13 points of damage. Saved traces exposed a mismatch between the tool’s unit helpers and the dataset’s answer representation.
Illustrative scale mismatch
Displayed value: 483, scale: thousand
Executor: thousands(483) → 483000
Reference convention: 483 with scale stored separately
The executor expanded thousands(...) by 1,000 and millions(...) by 1,000,000. TAT-QA’s checker expected the displayed number with scale metadata separate. The instructions permitted those helpers without clearly defining the conversion contract.
Those two helper families carried 28.70% of report-group weight and contributed −19.38 accuracy points. On matching raw-result traces, reversing the exact scale factor changed verification from 0/256 to 237/256 (92.58%) for thousands, and from 0/240 to 227/240 (94.58%) for millions.
We made this diagnostic change to saved raw tool results; we did not regenerate the model’s answer or validate a fix. Helper selection was not randomized. We could localize a large part of the loss, but could not establish a sole cause or show that changing the interface would recover the same final-answer accuracy.
The loss was already present before finalization.
We reran the preserved expressions and reproduced validity, result/error text and operation count in all 3,600 trials. Parsing and evaluator failures were too rare to explain the reversal. The final-answer turn improved raw-result accuracy by +10.36 points on FinQA and +28.96 on TAT-QA, using unrounded values.
| Stage / metric | FinQA | TAT-QA |
|---|---|---|
| Scheduled calculator trials | 1,800 | 1,800 |
| Expression schema parsed | 1,800 (100%) | 1,800 (100%) |
| Restricted evaluation valid | 1,784 (99.11%) | 1,789 (99.39%) |
| Final-answer schema parsed | 1,800 (100%) | 1,800 (100%) |
| Final answer verifier-parseable | 1,796 (99.78%) | 1,794 (99.67%) |
| Expression / final-answer repairs | 0 / 0 | 0 / 0 |
| Raw expression-result accuracy | 63.23% | 34.73% |
| Final-answer accuracy | 73.58% | 63.69% |
On TAT-QA, the first-answer-to-final-answer transition had 142 raw repair events and 417 damage events. The raw-tool-result-to-final-answer transition instead had 553 repairs and four damage events: +29.19 points of repair minus 0.23 of damage. The finalizer often recovered a bad tool result. It did not generally overwrite correct calculator results.
| Expression family | Source-group weight | Within-family effect, points | Contribution, points |
|---|---|---|---|
| thousands | 15.01% | −67.59 | −10.14 |
| millions | 13.69% | −67.49 | −9.24 |
| percent | 35.63% | +8.47 | +3.02 |
| No helper | 35.44% | +0.53 | +0.19 |
| percent + millions | 0.23% | 0.00 | 0.00 |
On matching thousand-scale traces, finalization copied the tool number in 250 of 256 cases and never reversed the factor. On million-scale traces, it copied in 158 cases and divided by one million in 78, with 68 correct terminal answers. Undoing the factor on a saved tool number helped us diagnose the scale contract. It did not produce a new model-generated terminal answer.
Robustness checks for the calculator reversal
| Check | FinQA | TAT-QA |
|---|---|---|
| Primary weighting | +10.72 | −16.18 |
| Equal task / trial micro-average | +11.11 | −15.28 |
| Across individual replicates | +9.71 to +11.65 | −17.20 to −14.93 |
| Leave one source group out | +10.28 to +11.26 | −16.70 to −15.80 |
| Disable 100× percent equivalence | +12.22 | −15.05 |
| Tight numeric tolerance | +4.77 | −10.52 |
| Loose 1% relative tolerance | +4.29 | −22.55 |
The sign reversal persisted when we changed weighting, separated replicates, left out source groups and varied the verifier. These offline checks test sensitivity; they do not replace the benchmark metrics or provide a causal test of helper use.
For an analytical product, we would check every part of the calculation: the selected operands, expression, scale, tool result and final answer. Correct arithmetic alone does not guarantee a useful answer.
07 / Check stability and repeatability
How stable were the effects across repeats and splits?
Across the ten fixed model–dataset cells, learning-to-held-out Pearson correlation was 0.97285 for retry effects and 0.93758 for calculator effects. Spearman correlations were 0.745 and 0.794; mean absolute effect changes were 1.75 and 4.01 points. The largest changes were 5.64 points for retry and 7.50 for calculator. These associations describe the models and datasets we tested. They do not establish transfer to unseen models or domains.
We also split each question’s six held-out intervention replicates into two groups of three. Across twenty model–dataset–action cells, Pearson correlations ranged from 0.784 to 0.990; their Spearman–Brown reliability corrections ranged from 0.879 to 0.995. These results support the model–dataset measurements at six repeats. We did not run the planned ten-repeat top-up, so we cannot establish that six repeats would suffice for every item-level analysis.
Complete split-half reliability results
| Model | Dataset | Retry Pearson | Retry SB | Retry Spearman | Retry MAHD | Calculator Pearson | Calculator SB | Calculator Spearman | Calculator MAHD |
|---|---|---|---|---|---|---|---|---|---|
| Qwen3.5-9B | FinQA | .889 | .941 | .876 | .092 | .865 | .927 | .848 | .112 |
| Qwen3.5-9B | TAT-QA | .859 | .924 | .856 | .117 | .854 | .921 | .750 | .067 |
| Gemma-4-12B-IT | FinQA | .949 | .974 | .938 | .046 | .962 | .981 | .953 | .029 |
| Gemma-4-12B-IT | TAT-QA | .972 | .986 | .971 | .028 | .956 | .978 | .899 | .017 |
| Phi-4 | FinQA | .836 | .911 | .838 | .131 | .844 | .915 | .840 | .127 |
| Phi-4 | TAT-QA | .847 | .917 | .810 | .123 | .784 | .879 | .785 | .154 |
| Qwen3-32B | FinQA | .965 | .982 | .958 | .036 | .951 | .975 | .945 | .044 |
| Qwen3-32B | TAT-QA | .937 | .967 | .930 | .054 | .920 | .958 | .916 | .046 |
| Gemma-4-31B-IT | FinQA | .986 | .993 | .981 | .014 | .976 | .988 | .968 | .020 |
| Gemma-4-31B-IT | TAT-QA | .990 | .995 | .980 | .010 | .975 | .988 | .982 | .023 |
08 / Can we choose before paying for the action?
The simple baseline was harder to beat than expected.
Our question-level router used eight outcome-blind inputs: four forecasts for action success, a standalone first-answer confidence estimate, the dataset label and two forecast-format failure flags. We fitted L2-regularized logistic mappings on 200 training tasks per model, with training-only standardization. Another 200 source-disjoint validation tasks selected regularization by expected-Bernoulli Brier score; we did not refit on the combined training and validation set. We then converted predictions to utility under each cost setting and evaluated action choices on 600 held-out tasks per model. The model-aware version included model and action interactions.
We compared it with a pooled question-level router and a static lookup that estimated historical success for each model × dataset × action. The lookup uses the model and dataset identities at inference time, without collecting the extra forecasts for each question.
For each cost setting, the reported policy score maps realized utility to a 0–1 scale using that setting’s attainable minimum and maximum. A higher score means higher utility under those assigned costs. This normalization changes the reporting scale, not which action maximizes utility.
| Selection rule | Labels per model | Selected regularization C | Validation Brier | Held-out utility |
|---|---|---|---|---|
| Pooled question-level router | 200 | 0.01 | 0.22884 | 0.70891 |
| Model × action offsets | 200 | 0.03 | 0.22508 | 0.72134 |
| Static model × dataset lookup; all learning | 400 | — | — | 0.72601 |
| Static model × dataset lookup; train only | 200 | — | — | 0.72589 |
| Full model-aware question-level router | 200 | 0.03 | 0.22331 | 0.72693 |
The L2 regularization grid was 0.001, 0.003, 0.01, 0.03, 0.1, 0.3, 1, 3 and 10. The pooled, offset and full logistic designs had 27, 39 and 135 columns. Each learning task–action received total weight one, shared equally across its intervention replicates. Failed vector forecasts were imputed as four 0.5 values and a failed scalar as 0.5, with parse-failure flags retained. Validation selected by expected-Bernoulli Brier score, with smaller C breaking exact ties. Four-action utility choices used the fixed keep, abstain, retry, calculator tie order within 10−12.
The model × action offset router gained +0.01244 over pooled [95% CI +0.00914, +0.01577]. Full-minus-pooled gains by model were +0.00658 for Qwen3.5-9B, +0.02823 for Gemma-4-12B-IT, +0.01990 for Phi-4, +0.01204 for Qwen3-32B and +0.02338 for Gemma-4-31B-IT. These differences are in normalized utility, not accuracy points.
The full router improved on the pooled version by 0.01803 (95% CI 0.01362 to 0.02234). Its gain over the 400-label lookup was just 0.00092, with a 95% CI from −0.00252 to +0.00440. With the 200-label lookup, the gain was 0.00104 (−0.00264 to +0.00480).
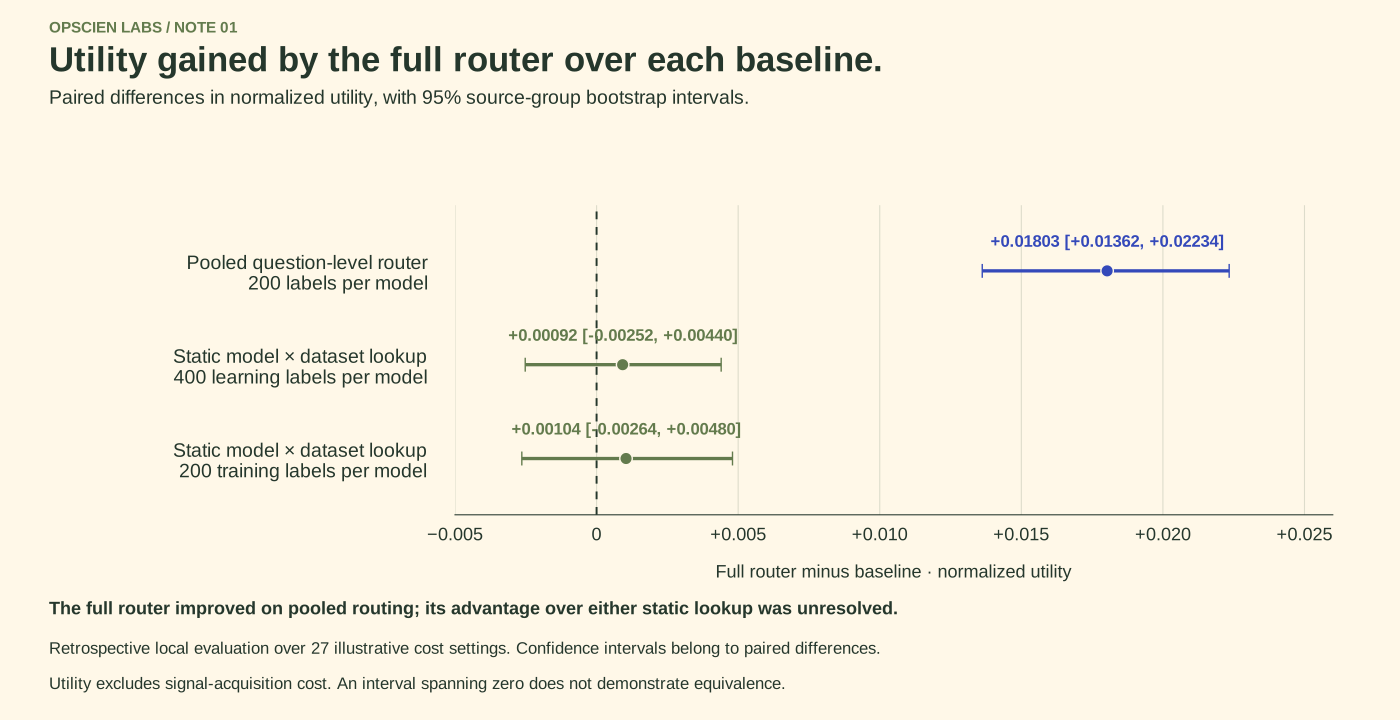
We could not establish extra question-level value in either comparison. The intervals do not prove equivalence; they leave the full router’s advantage unresolved. The static lookup gives us a strong baseline with little overhead, which a more elaborate controller needs to beat.
Did asking for separate action forecasts help?
We could make the closest action-vector versus scalar comparison for only the two later models. The vector’s utility change was +0.00144 for Qwen3-32B (95% CI −0.00199 to +0.00517) and −0.00629 for Gemma-4-31B-IT (−0.01366 to +0.00055). The matched scalar came from the same forecast prompt and used learned per-action calibration. We could not establish a vector advantage in either result.
Both methods used the same action menu, 27 settings and utility rule. The matched scalar was calibrated from the answer component of the vector prompt; the standalone scalar was elicited separately. Per-action identity or Platt calibration was fitted on training data and chosen on validation. All six extension model–action maps selected Platt. We kept held-out labels out of this comparison’s predictions, but the archived chronology did not show a prospective prediction lock.
| Model | Comparison | Difference | 95% CI |
|---|---|---|---|
| Qwen3-32B | Vector − matched scalar | +0.00144 | [−0.00199, +0.00517] |
| Gemma-4-31B-IT | Vector − matched scalar | −0.00629 | [−0.01366, +0.00055] |
| Qwen3-32B | Vector − standalone scalar | −0.00361 | [−0.00782, +0.00034] |
| Gemma-4-31B-IT | Vector − standalone scalar | −0.01093 | [−0.02093, −0.00105] |
External controller versus the model’s native choice
For three displayed cost cards—balanced, high-stakes and resource-constrained—we compared expected-utility selection from the uncalibrated action forecasts with the model’s own belief-visible choice. Each model had 600 held-out questions × 3 cards = 1,800 task–card rows. Parse failures were omitted; rows selecting the unexecuted delegate were bounded by substituting delegate success zero or one. This comparison uses raw utility, not the normalized score above.
| Model | Evaluable rows / 1,800 | Utility difference | Endpoint bounds |
|---|---|---|---|
| Qwen3.5-9B | 1,793 | +0.04497 | [+0.04363, +0.04754] |
| Gemma-4-12B-IT | 1,726 | −0.22444 | [−0.25641, −0.11378] |
| Phi-4 | 1,771 | +0.03102 | [−0.00167, +0.05486] |
| Qwen3-32B | 1,799 | −0.00849 | [−0.01019, −0.00817] |
| Gemma-4-31B-IT | 1,779 | +0.10118 | [+0.08724, +0.12477] |
| Equal-model aggregate | — | −0.01115 | [−0.02748, +0.02105] |
These ranges bound the missing delegation outcomes; they are not confidence intervals. We found mixed signs, and the aggregate bounds crossed zero, so we cannot conclude that an external controller universally wins. This historical analysis used the exact floating-point maximum in menu order, rather than the near-tie tolerance used in the other policy analyses.
09 / What looking inside the model added
Better estimates of correctness did not guarantee better estimates of action benefit.
Local execution let us retain exact prompts and generated token records, summarize token scores and capture selected hidden-state snapshots around the first-answer generation. We kept the model weights frozen. Hidden snapshots came from the initial generation, never a format-repair response. We collected these measurements for the local models; the completed hosted experiment had no equivalent signal suite.
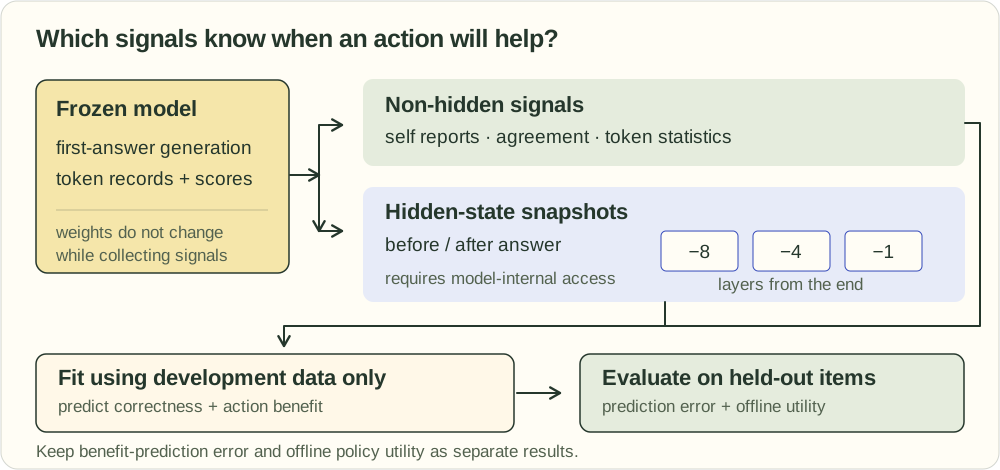
Post-answer confidence prompts could see the parsed first answer, but not its correctness label or the realized retry/calculator outcomes. “Outcome-blind” refers to those withheld outcomes; it does not mean that every feature was collected before the first answer. The non-hidden bundle combined P(True), the model’s reported probability that its answer was right; P(IK), its reported probability that it knew enough; exact agreement across the first answer plus four fresh samples; and eight token statistics. Those statistics covered sequence likelihood, bits per byte, first-token entropy, geometric mean token probability, mean logit margin, mean next-token entropy, mean token log-probability and minimum token probability.
We then added selected hidden-state vectors from the last prompt token before generation or the final generated token of the structured answer. Candidate transformer blocks were −8, −4 and −1. Full-vocabulary logits were converted to FP32 temporarily for summaries; pooled hidden vectors moved to CPU in FP32. We did not retain the full activation cube or compare raw vectors across architectures.
Scaling and PCA used training data only. Validation selected the layer, compressed width (8, 16 or 32) and ridge strength (0.1, 1, 10 or 100). Complete held-out signals covered 2,998 of 3,000 model–question pairs. For this signal analysis, we did not use the four action forecasts that went into the main router.
| Change in signal bundle | Change in error | 95% CI |
|---|---|---|
| Richer non-hidden bundle versus P(True) only | −0.02053 | [−0.02485, −0.01591] |
| Add pre-generation hidden snapshot | +0.00241 | [+0.00009, +0.00474] |
| Add post-answer hidden snapshot | +0.00433 | [+0.00202, +0.00658] |
| Pre-generation hidden + non-hidden versus P(True) only | −0.01813 | [−0.02306, −0.01324] |
| Post-answer hidden + non-hidden versus P(True) only | −0.01621 | [−0.02110, −0.01113] |
The target was intervention success probability minus first-answer success probability, averaged equally across retry and calculator. Richer non-hidden signals improved this prediction. Adding the hidden snapshots we tested made the error slightly larger. This result concerns these layers, positions and fitted mappings; it does not describe all the information inside a model.
The aggregate non-hidden gain was driven mainly by calculator-benefit prediction and Phi-4 retry. Pre-generation hidden signals helped isolated cells—Phi-4 retry by −0.00910 MAE and Qwen3.5-9B calculator by −0.01668—but worsened others. We cannot generalize those mixed effects to all hidden representations.
The hidden states helped a different decision target.
In another offline cost simulation, normalized policy scores rose from 0.71486 for P(True) alone to 0.73528 for the richer non-hidden bundle, 0.74397 with post-answer states, and 0.74767 with pre-generation states. The latter gains versus non-hidden signals were +0.00869 (95% CI 0.00367 to 0.01374) and +0.01239 (0.00712 to 0.01766).
| Signal family | Normalized utility | Oracle regret |
|---|---|---|
| P(True) only | 0.71486 | 0.17753 |
| Richer non-hidden bundle | 0.73528 | 0.15711 |
| Post-answer hidden + non-hidden | 0.74397 | 0.14841 |
| Pre-generation hidden + non-hidden | 0.74767 | 0.14472 |
Separately fitted first-answer correctness MAE was 0.3596 for the non-hidden bundle, 0.3494 with pre-generation states and 0.3475 with post-answer states. The empirical oracle uses observed outcomes and is an in-sample ceiling, not a deployable controller.
Improved estimates of first-answer correctness could explain these utility gains. We did not run an ablation that isolated that channel, so we cannot attribute the gain to it causally. Higher utility does not overturn the weaker direct benefit prediction. Neither result includes the full cost of gathering signals.
10 / Earlier experiments and unfinished work
How we reached these experiments
We began with exploratory choices, tested feasibility, and then ran the complete action experiments. We also stopped or left unfinished several planned runs. The table shows how each stage contributed, without counting incompatible or repeated observations as one sample.
| Stage | What actually completed | How it informs this post |
|---|---|---|
| Exploratory action-choice study | 13 requested models; 23,701 raw and 23,082 clean/scored decisions on 1,000 FinQA items | Motivation only: non-answer payoffs were property-derived, rather than forced action outcomes |
| Reduced pilot | Four models × 50 questions; 1,400 terminal trials | Feasibility evidence; full gates did not pass, excluded from main effects |
| Earlier three-model run | 8,400 learning outcomes and 1,800 blind test-feature records; no held-out action outcomes | Superseded run on the same source examples, not extra sample size |
| Aligned local core | Qwen3.5-9B, Gemma-4-12B-IT, Phi-4; 31,800 complete trials | Primary local action evidence |
| Local extensions | Qwen3-32B and Gemma-4-31B-IT; 21,200 complete trials | Complete extension evidence, explicitly marked |
| Hosted models | Seven hosted models; 27,300 scheduled requests, 27,299 returned records | Separate terminal-answer and expression-result diagnostic |
| Fixed-model delegation | Forecasted and offered in choice menus; no outcome bank | No delegate-effect estimate |
| Transfer datasets | When2Tool: 1,620 prepared tasks; TrustSQL: 2,068 | Prepared data, no executed model-result claim |
| Wider confirmation and audits | Ten-peer launch dry run; ten-repeat top-up and equivalent-presentation audit unrun | No completed efficacy result |
Our earlier action-choice experiment
We tested thirteen models under these provider names: Claude Opus 4.6, Claude Sonnet 4.6, Claude Haiku 4.5, Llama 4 Maverick, DeepSeek V3.2, Qwen3-235B, Qwen3-32B, Kimi-K2.5, GPT-OSS-120B, GLM-5, Nemotron-Super-120B, MiniMax-M2 and Gemini 3.5 Flash. That exploratory run studied five-way action-choice prompting. Its non-answer utility came from task properties instead of executing each model–question–action combination. It motivated the complete forced-action design, but did not provide another set of retry or calculator outcomes.
Incomplete local work and prepared transfer tests
Llama-3.3-70B-Instruct produced one 97-question learning shard with 679 trials, without completing the learning or held-out experiment. Llama-3.1-8B-Instruct failed the repair-rate gate; GPT-OSS-20B hit infrastructure failures with no scientific outcomes; OLMo3-7B-Instruct failed probability-format checks. OLMo-3.1-32B-Instruct was prepared only. Falcon3-10B and Mistral-7B-Instruct-v0.3 pilots stopped after 30 and six questions respectively. These runs explain why some models did not enter the final results; they do not contribute effectiveness estimates.
When2Tool’s prepared splits contained 540 fit, 180 validation, 450 in-distribution test and 450 held-out-environment tasks. TrustSQL contained 1,014 validation and 1,054 test tasks. No transfer-model outcomes were collected. QASPER, HiL-Bench and When2Call also produced no completed results used here.
Which questions we could answer
| Question | Measured result / status |
|---|---|
| Action vector versus calibrated scalar | Two extension models; no supported gain over the matched scalar |
| External controller versus native choice | Five local models; heterogeneous effects, aggregate delegation bounds cross zero |
| Model-aware versus pooled routing | Full router beat pooled; no established gain beyond static model–dataset action rates |
| Richer non-hidden signals | Aggregate intervention-benefit MAE improved, with cell heterogeneity |
| Selected late hidden states | Aggregate benefit MAE worsened; separate offline policy utility improved |
| Recompose forecasts under changed costs | Worked arithmetically on the fixed 27-setting grid; no test of unseen verbal preferences |
| Equivalent ways to present the same utility | Not evaluated; no complete audit result |
We stopped the original matched local/hosted experiment at a dry run. Its planned hosted roster included Sonnet, Terra and Gemini Flash models, which we superseded in the completed experiment. We also changed the fixed delegate during planning, but ran no action outcomes for either configured delegate. The prepared infrastructure and launch plans cannot answer the missing comparisons.
11 / What we could not establish
Where these results stop
- What we ran: a five-model local outcome experiment, retrospective local routing and signal analyses, and a separate seven-model hosted experiment. Delegation, a matched hosted/local comparison, broader transfer tasks and wider attention or controller audits did not produce results used here.
- Scope: curated financial arithmetic on two related datasets. We tested five fixed local models from three families and seven hosted models with different collectors. Neither model roster is a random sample. We did not measure benchmark contamination or establish cross-domain behavior.
- Timing: held-out labels were excluded from fitting and tuning, but the precise routing and probe analyses were chosen retrospectively after outcomes existed. We had no complete prediction-lock record that prospectively confirmed them. The two extensions had stronger outcome-blind staging evidence, but that does not make their analyses confirmatory.
- Data binding: current task-file bytes differed from an earlier contract snapshot because a 62-byte dataset-revision field was added or removed per record, changing derived task IDs. An exact source/content crosswalk matched all 1,000 questions, contexts, source groups and split memberships. We could establish continuity of the source examples, but not byte-identical provenance.
- Signal alignment: some feature records came from separate passes over the same task IDs without byte-level proof of identical first answers. We can interpret those findings as task-level associations, but not as causal claims about one exact activation trace.
- Internal access: selected late layers and two token positions do not cover all possible internal representations. Improved offline utility is compatible with weaker direct intervention-benefit prediction.
- Real cost: utility weights omit confidence-prompt and consistency-sampling costs. We could not reconstruct exact GPU-hours or establish net value in deployment.
- Product transfer: these benchmark results inform what to test in Opscien; they do not validate its production accuracy or performance.
12 / What we take back to the product
Make every extra step earn its place.
These experiments leave us with four things to check in a product: repairs and damage separately; the full expression, unit and output contract; routing against historical model–dataset action success; and the actual provider request interface and collector. Confidence and internal access can add useful measurements, but we need to evaluate them against the prediction target and their acquisition cost.
Next, we would count the whole decision path: signal collection, model and tool calls, output validation and latency. We still need to know whether a routing gain survives those costs at an acceptable error rate. Offline decision utility alone cannot answer that question.
At Opscien Labs, we publish interesting findings and the evidence behind them. Here we have reported what we found, what we could not establish, and what we would test next.
Back to Opscien Labs